JVM Processes Displays
The RTView Manager JVM displays present performance data for monitored Java Virtual Machine (JVM) processes. Use these displays to examine the current and historical performance metrics and resource usage of JVMs. Any JVM that is enabled for monitoring can be included in these displays. The displays include summary overviews and detail pages with historical trends.
You can set alert thresholds on performance and resource metrics for your JVMs, including CPU Percent, Memory Used and Gc Duty cycle. Alerts are shown in the JVMs Heatmap display. Use the detailed JVM displays to investigate further; for example a Memory Used alarm might take you to the JVM Summary display to get historical memory use, or a Gc Duty Cycle alarm might take you to the JVM GC Trends display. Displays in this View are:
The HTML version features an overview display, JVM Overview (pictured below), and the following displays which can be found unde Components tab > Processes /JVM Processes once RTView Manager is installed:
| • | JVMs Heatmap : Heatmap of alert states for all JVM connections |
| • | JVM Summary : Table of connection details for all JVM connections. |
| • | JVM System Properties : Table of connection details for a single JVM as well as performance trend graphs. |
| • | JVM GC Trends : Trend graphs of garbage collection memory utilization. |
JVM Overview
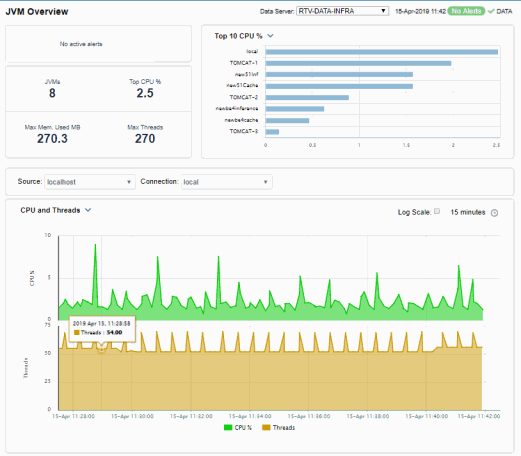
The JVM Overview is the top-level display for the JVM Solution Package, which provides a good starting point for immediately getting the status of all your JVM instances on your Data Server.
Choose a DataServer for which you want to see data and easily view the current data for that DataServer including:
| • | The total number of active alerts, including the total number of critical and warning alerts. |
| • | The number of JVMs and the Top CPU % user across all servers. |
| • | The maximum memory used and maximum number of threads. |
A bar graph shows the JVMS with Top 10 CPU % utilization. Use the drop-down menu to show JVMS with Top 10 Used Heap memory utilization and JVMS with Top 10 Live Threads.
You can hover over each region in the upper half of the Overview to see more detail. You can also drill down to see even more detail by clicking on each respective region in the Overview.
For example, clicking on the alerts in the CRITICAL and WARNING alerts region opens the Alerts Table display. Clicking on Top CPU % opens the JVM Summary display.
The bottom half of the display provides a performance trend graph for a connection on the DataServer. Choose a Source and Connection from the drop-down menus. Use the trend graph drop-down menu to show metrics for CPU and Threads utilization or Heap Memory utilization.
You can hover over the trend graph to see the values at a particular time. You can specify the time range for the trend graph and view data based on a log scale, which enables visualization on a logarithmic scale and should be used when the range in your data is very broad.
JVMs Table
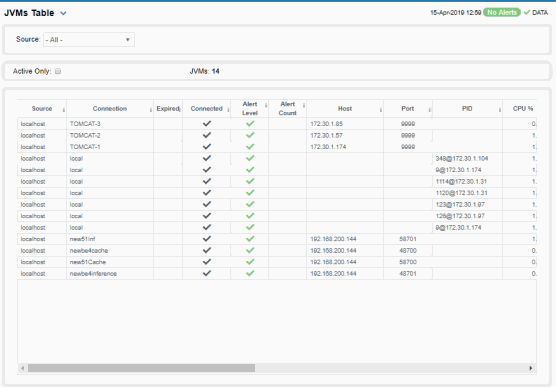
Investigate JVM connection utilization metrics and configuration information for one or all JVMs. Choose one or All JVMs from the Source drop-down menu. Each row in the table contains data for a particular connection on the selected JVM(s).
This display contains all metrics available for JVM connections, including the Port number and the current most critical Alert Level, where:
 Red indicates that one or more alerts exceeded their ALARM LEVEL threshold in the table row.
 Yellow indicates that one or more alerts exceeded their WARNING LEVEL threshold in the table row.
 Green indicates that no alerts exceeded their WARNING or ALARM LEVEL threshold in the table row.
You can search, filter, sort and choose columns to include by clicking a column header icon (to the right of each column label) and selecting Filter, Sort Ascending, Sort Descending or Columns.
Or just click a column header to sort.
Right-click on a table cell to Export to Excel or Copy Cell Value.
Double-click on a table row to drill-down to the JVM Summary - HTML display and view metrics for the JVM hosting the connection.
Check the Show Inactive box to include inactive connections.
Toggle between the commonly accessed Table and Heatmap displays by clicking the drop down list on the display title.
Right-click on a table cell to Export to Excel or Copy Cell Value.
JVMs Heatmap
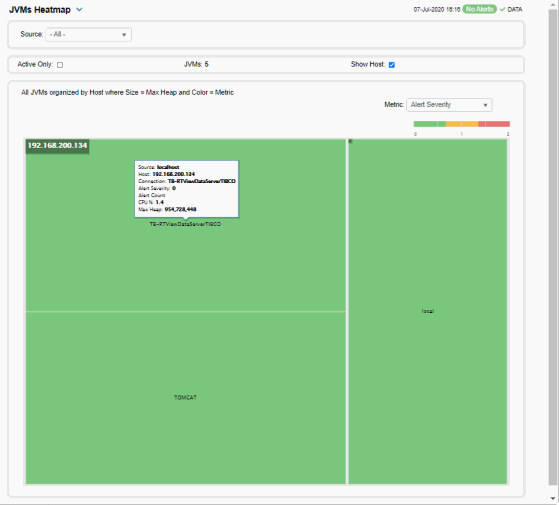
View the alert state for all monitored JVM connections for one or all sources, as well as CPU and memory utilization. The heatmap organizes JVM connections by host, and uses color to show the selected Metric value for each JVM connection.
Each rectangle in the heatmap represents a JVM connection. The rectangle size represents the amount of memory reserved for that process; a larger size is a larger value. Each Metric (selected from the drop-down menu) has a color gradient bar that maps relative values to colors.
Choose one or All sources from the Sources drop-down menu. Use the check-boxes to include or exclude labels in the heatmap. Move your mouse over a rectangle to see detailed JVM connection information (including PID). Drill-down and investigate by clicking a rectangle in the heatmap to view details for the selected connection in the JVM Summary display.
|
|
Metric Select the Metric to display in the heatmap. Each Metric has a color gradient bar that maps relative values to colors. |
||
|
|
|
Alert Severity |
The maximum level of alerts in the heatmap rectangle. Values range from 0 - 2, as indicated in the color gradient
|
|
|
|
Alert Count |
The number of alerts for the rectangle. The color gradient |
|
|
|
CPU % |
The total percent (%) CPU utilization for the rectangle. The color gradient |
|
|
|
Memory % |
The total percent (%) memory utilization for the rectangle. The color gradient |
|
|
|
Current Heap |
The current amount of heap committed for the connection, in kilobytes. The color gradient |
|
|
|
Used Heap |
The total amount of heap used by the connection, in kilobytes. The color gradient |
JVM Summary
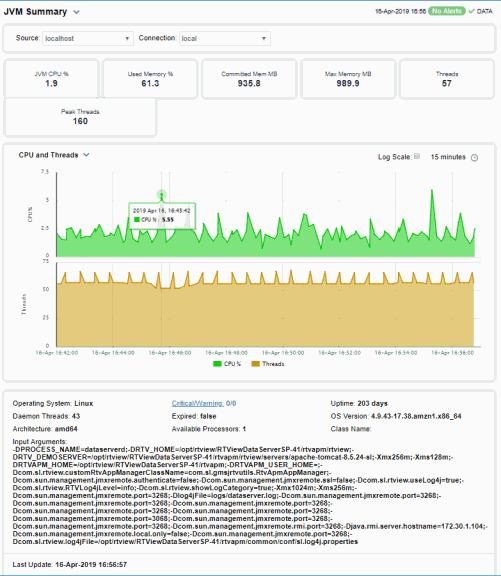
Track utilization by a single connection on a JVM, including Memory and CPU usage, amount of Committed Memory (the amount of memory, in megabytes, guaranteed to be available for use by the JVM).
Choose a Source and Connection from the drop down menus. The amount of committed memory can be a fixed or variable size. If set to be a variable size, the amount of committed memory can change over time, as the JVM may release memory to the system. This means that the amount allocated for Committed memory could be less than the amount initially allocated. Committed memory will always be greater than or equal to the amount allocated for Used memory and Maximum Memory used, number of Threads and Peak Threads.
You can also verify whether the memory usage has reached a plateau. And if usage is approaching the limit, determine whether to allocate more memory.
Clicking on the information boxes at the top of the display takes you to the JVMs Table - HTML display, where you can view and compare with other connections on the JVM.
You can set the time range for the trend graph to trace. You can also choose what to trace from the drop-down menu:
| • | CPU and Threads traces the amount of CPU used by the JVM and the total number of live threads. |
| • | Heap Memory traces the amount of memory used for memory management by the application in the time range specified. This value may change or be undefined. Note that a memory allocation can fail if the JVM attempts to set the Used memory allocation to a value greater than the Committed memory allocation, even if the amount for Used memory is less than or equal to the Maximum memory allocation (for example, when the system is low on virtual memory). |
At the bottom of the display you also can get JVM operating system information, the number of processors available to the JVM, the Architecture which is the ISA used by the processor, the number of Daemon Threads and Input Arguments for starting JVM.
Clicking the Critical/Warning link at the bottom of the display opens the Alerts Table by Component display.
JVM System Properties
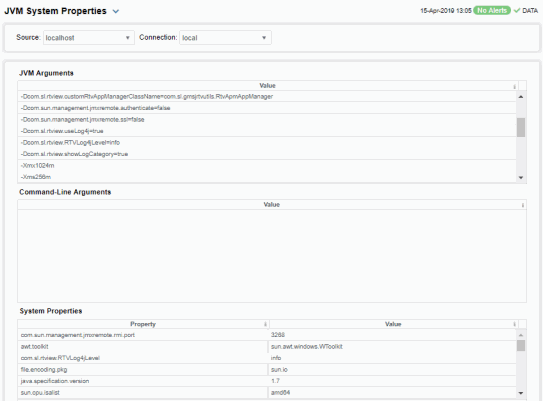
View JVM arguments in the RuntimeMXBean InputArguments attribute, command line arguments for starting applications and system properties settings for a connection.
Choose a Source and Connection from the drop-down menus. You can search, filter, sort and choose columns to include by clicking a column header icon (to the right of each column label) and selecting Filter, Sort Ascending, Sort Descending or Columns.
Or just click a column header to sort.
Right-click on a table cell to Export to Excel or Copy Cell Value.
Click a column header to sort column data in ascending or descending order or right-click to filter data shown in the display. Toggle between the commonly accessed Table and Heatmap displays by clicking the drop down list on the display title.
JVM GC Trends
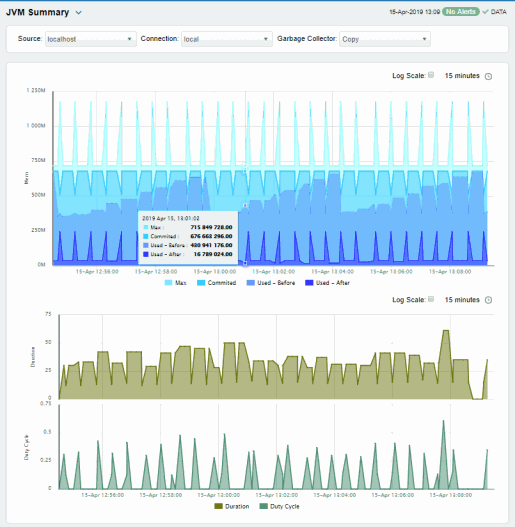
Track JVM garbage collection memory utilization trends for a single connection. Choose a Source, Connection and Garbage Collector from the drop-down menus. The upper trend graph traces the following for the selected garbage collector for the time range specified:
| • | Max: The maximum amount of memory, in megabytes, used for JVM garbage collection. |
| • | Committed: The amount of memory, in megabytes, guaranteed to be available for use by JVM non-heap memory management. Note that the amount of committed memory can be a fixed or variable size. If set to be a variable size, it can change over time, as the JVM may release memory to the system. This means that the amount allocated for committed memory could be less than the amount initially allocated. Committed memory will always be greater than or equal to the amount allocated for used memory. |
| • | Used - Before: The amount of memory, in megabytes, used before the last garbage collection. |
| • | Used - After: The amount of memory, in megabytes, used after the last garbage collection. |
The lower trend graph traces the following for the selected garbage collector for the time range specified:
| • | Duration: The duration, in seconds, of garbage collection. |
| • | Duty Cycle: The percentage of time that the application spends in garbage collection. |
You can hover over the trend graph to see the values at a particular time.
You can specify the time range for the trend graph and view data based on a log scale, which enables visualization on a logarithmic scale and should be used when the range in your data is very broad.
 bar, where 2 is the highest Alert Severity.
 Red indicates that one or more alerts have reached their alarm threshold. Alerts that have exceeded their specified ALARM LEVEL threshold have an Alert Severity value of 2.
 Yellow indicates that one or more alerts have reached their alarm threshold. Alerts that have exceeded their specified WARNING LEVEL threshold have an Alert Severity value of 1.
 Green indicates that no alerts have reached their alert thresholds. Alerts that have not exceeded their specified thresholds have an Alert Severity value of 0.
 bar values range from 0 to the maximum number of alerts in the heatmap.
 bar values range from 0 to the maximum percent (%) CPU utilization in the heatmap.
 bar values range from 0 to the maximum percent (%) memory utilization in the heatmap.
  bar values range from 0 to the maximum amount in the heatmap.
 bar values range from 0 to the maximum amount used in the heatmap.