These displays allow you to compare data between two sets of time ranges.
Service Comparison: Analyze service data for two sets of time ranges.
Cache Comparison: Analyze cache data for two sets of time ranges.
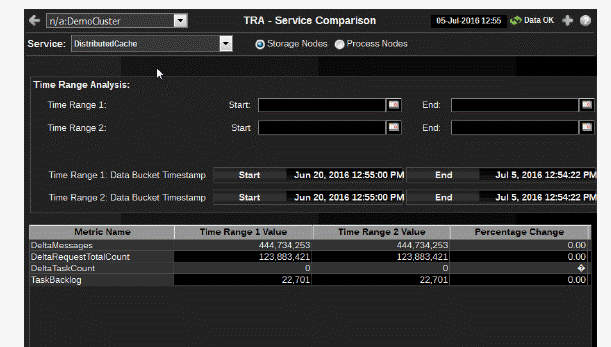
This display allows for analysis of service data for two sets of time ranges.

|
Cluster |
Select a cluster to display. |
|
Service |
Select a service to display. |
|
Storage Nodes |
Select to display storage node data in the trend graphs of this display. |
|
Process Nodes |
Select to display process node data in the trend graphs of this display. |
|
Time Range Analysis |
Time Range 1: Set Start and End times for Time Range 1 Time Range 2: Set Start and End times for Time Range 2 Time Range 1: Data Bucket Timestamp and Time Range 2: Data Bucket Timestamp displays the Start and End timestamps for the actual data buckets used in the comparison, since data may be compacted into buckets with different Start and End times from the specified values. |
|
Time Range |
Select a time range from the drop down menu varying from 2 Minutes to Last 7 Days, or display All Data. To specify a time range, click Calendar 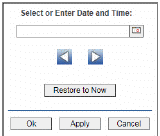
By default, the time range end point is the current time. To change the time range end point, click Calendar Use the navigation arrows Click Restore to Now to reset the time range end point to the current time.
|
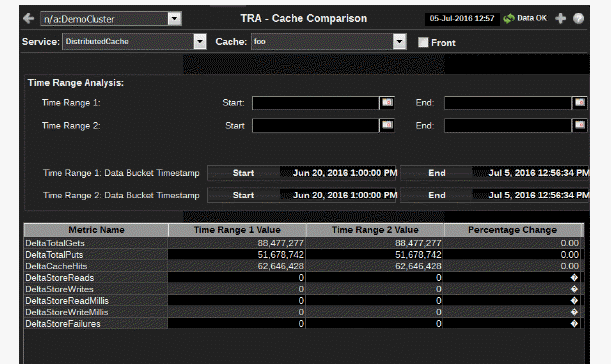
This display allows for analysis of cache data for two sets of time ranges.
|
Cluster |
Select a cluster to display. |
|
Service |
Select a service to display. |
|
Storage Nodes |
Select to display storage node data in the trend graphs of this display. |
|
Process Nodes |
Select to display process node data in the trend graphs of this display. |
|
Time Range Analysis |
Time Range 1: Set Start and End times for Time Range 1 Time Range 2: Set Start and End times for Time Range 2 Time Range 1: Data Bucket Timestamp and Time Range 2: Data Bucket Timestamp displays the Start and End timestamps for the actual data buckets used in the comparison, since data may be compacted into buckets with different Start and End times from the specified values. |
|
Time Range |
Select a time range from the drop down menu varying from 2 Minutes to Last 7 Days, or display All Data. To specify a time range, click Calendar 
By default, the time range end point is the current time. To change the time range end point, click Calendar Use the navigation arrows Click Restore to Now to reset the time range end point to the current time.
|
 .
.  and select a date and time from the calendar or enter the date and time in the text field using the following format:
  to move forward or backward one time period. NOTE: The time period is determined by your selection from the
  .
.  and select a date and time from the calendar or enter the date and time in the text field using the following format:
  to move forward or backward one time period. NOTE: The time period is determined by your selection from the