These displays provide detailed metrics for brokers and their connected brokers. Displays in this View are:
Brokers Overview: Health snapshot of top 10 most utilized VPNs, trend graphs trace key performance metrics such as messages sent/received and connected clients.
Brokers Heatmap: A color-coded heatmap view of the current status of each of your brokers.
Brokers Table: A tabular view of all available broker performance data.
Broker Summary: Current and historical metrics for a single broker.
Broker Sensors: Provides value and status information for all sensors on a single broker or for all sensors for all brokers.
Broker Provisioning: Provides broker details such as host, chassis, redundancy, memory, and fabric data for a particular broker.
Broker Interface : Provides detailed data and status information for the interfaces associated with one or all broker(s). You can also view current and historical amounts of incoming and outgoing packets and bytes for a selected interface in a trend graph.
Brokers Message Spool : Provides status and usage data for message spools associated with one or all broker(s).
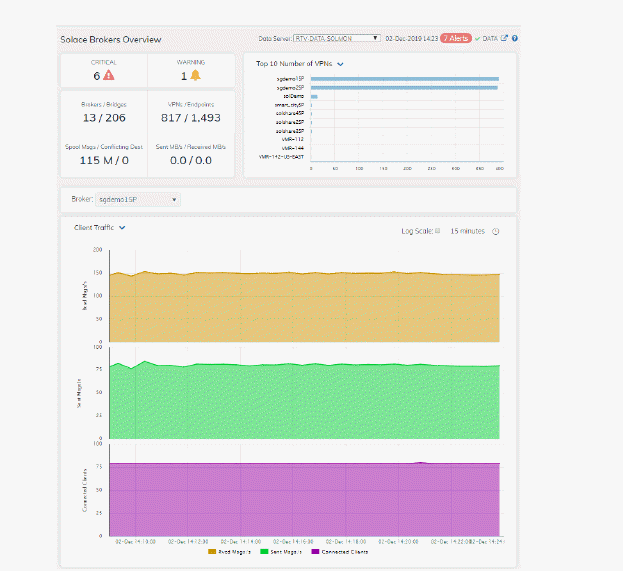
The Brokers Overview is the top-level display, which provides a good starting point for immediately getting the status of all your brokers on your Data Server.
Select a data server, broker and metric from the drop-down menus. Consider keeping this display open for monitoring at a glance. You can easily view the current data for that Data Server including:
Top 10 most utilized VPNs / Endpoints, Clients Connected and Spooled Messages.
The number of Brokers / Bridges.
The number of Spooled Messages / Conflicting Destinations.
The number of Sent MBs per second / Received MB per second.
You can hover over each area in the upper half of the Overview to see more detail. You can also drill down to see even more detail by clicking on each metric card in the Overview.
The bottom half of the display provides a performance trend graph for queries for a selected broker. The trend graph traces the performance metric you select: Client Traffic, Spool Msgs or Memory.
You can hover over the trend graph to see the values at a particular time. You can specify the time range for the trend graph and view data based on a log scale, which enables visualization on a logarithmic scale and should be used when the range in your data is very broad.
|
CRITICAL |
Total number of current critical alerts for brokers on the selected data server. |
|
|
WARNING |
Total number of current critical alerts for brokers on the selected data server. |
|
|
Brokers/Bridges |
Total number of brokers/bridges on the selected data server. |
|
|
VPNs/Endpoints |
Total number of VPNs/endpoints on the selected data server. |
|
|
Spooled Msgs/Conflicting Dest |
Total number of spooled messages/conflicting destinations on the selected data server. |
|
|
Sent MBs/Received MBs |
Total number of MBs sent/MBs received on the selected data server. |
|
|
Top 10 Number of VPNs |
Ten brokers with the greatest number of connected VPNs. |
|
|
Broker |
Select a broker to trace performance metrics in the trend graph, then choose a metric: Client Traffic: Traces the number of messages received per second, messages sent per second and the number of connected clients. Spool Msgs: Traces the number of spooled messages and spool size (in megabytes.) |
|
|
Time Settings
|
By default, the time range end point is the current time. To change the time range, click the Time Settings
Toggle forward/backward in the trend graph per the period you choose (from the Time range drop-down menu) using arrows Restore settings to current time by selecting now
|
|
|
Log Scale |
Select to enable a logarithmic scale. Use Log Scale to see usage correlations for data with a wide range of values. For example, if a minority of your data is on a scale of tens, and a majority of your data is on a scale of thousands, the minority of your data is typically not visible in non-log scale graphs. Log Scale makes data on both scales visible by applying logarithmic values rather than actual values to the data. |
|
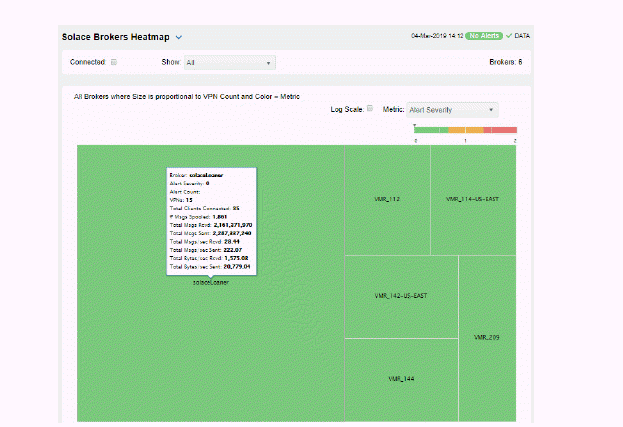
View the current status and alerts in a heatmap of all brokers or a subset of brokers. Use the Show dropdown menu to choose All brokers, Expired brokers, Unexpired brokers or only brokers in Standby mode
Each rectangle in the heatmap is a single broker where the rectangle size represents the number of connections. The rectangle color maps where the current value is on its color gradient  bar. Select a broker from the drop-down menu. For example, by default, Alert Severity is shown:
|
Alert Severity |
The current alert severity. Values range from 0 - 2, as indicated in the color gradient
|
|
Click a rectangle to drill down to details about a broker in the Broker Summary display.
Mouse over a rectangle to see additional details. Use the check-box  to include / exclude Connected brokers and enable Log Scale mode.
Consider keeping this display open for monitoring your Solace brokers at a glance.
|
Alert Severity |
The current alert severity. Values range from 0 - 2, as indicated in the color gradient
|
|
|
Alert Count |
The total number of critical and warning alerts. The color gradient |
|
|
# Msgs Spooled |
The total number of spooled messages. The color gradient |
|
|
Total Msgs Rcvd |
The total number of received messages. The color gradient |
|
|
Total Msgs Sent |
The total number of sent messages. The color gradient |
|
|
Total Msgs/ sec Rcvd |
The number of messages received per second. The color gradient |
|
|
Total Msgs/ sec Sent |
The total number of messages sent per second. The color gradient |
|
|
Total Bytes/ sec Rcvd |
The total number of bytes received per second in the broker. The color gradient |
|
|
Total Bytes/ sec Sent |
The total number of bytes sent per second in the broker. The color gradient |
|
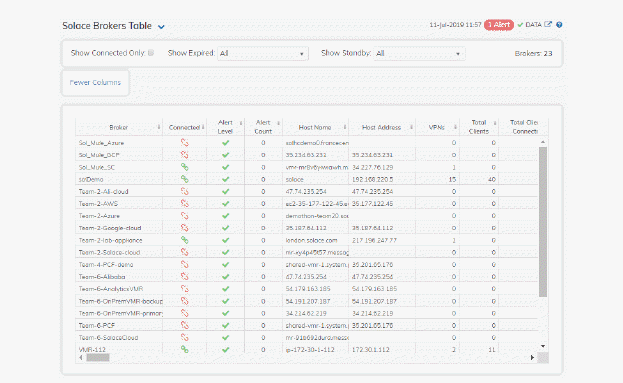
Investigate detailed utilization metrics for all brokers. This display provides a tabular view of the performance metrics shown in the Brokers Heatmap (alert level, alert count, and so forth), but with additional metrics such as Egress and Ingress values.
Use the Show: dropdown menu to view the current status of All brokers, Expired brokers, Unexpired brokers or just brokers in Standby mode.
Each row in the table contains data for a particular broker. Click a column header to sort column data in ascending or descending order. Double-click on a table row to drill down to the Broker Summary display and view metrics for that particular broker. Toggle between the commonly accessed Table and Heatmap displays by clicking the drop down list on the display title.
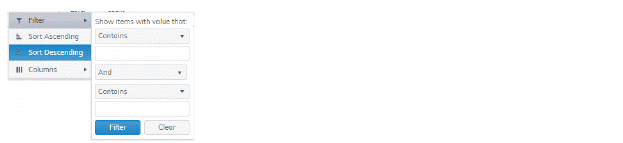
Search by clicking the right side of a column heading/Filter to open the Search, Sort and Choose Columns dialog:

Brokers: (in the upper right portion) is the number of brokers in the display.
Use the check-boxes  to include / exclude Connected and Expired brokers.
Export to Excel by right-clicking a column heading.
Toggle between More Columns / Fewer Columns  .
.
|
|
Broker |
The name of the broker. |
||
|
|
Connected |
The broker state:
|
||
|
|
Alert Severity |
The current alert severity:
|
||
|
|
Alert Count |
The total number of alerts. |
||
|
|
Expired |
When checked, performance data about the sensor has not been received within the time specified. |
||
|
|
Host Name |
The name of the host. |
||
|
|
Platform |
The name of the platform. |
||
|
|
OS Version |
The version of the operating system. |
||
|
|
Up Time |
The amount of time that the broker has been up and running. |
||
|
|
VPNs |
The total number of VPNs configured on the broker. |
||
|
|
Total Clients |
The total number of clients associated with the broker. |
||
|
|
Total Clients Connected |
The total number of clients that are currently connected to the broker. |
||
|
|
Clients Using Compression |
The number of clients who send/receive compressed messages. |
||
|
|
Clients Using SSL |
The number of clients using SSL for encrypted communications. |
||
|
|
Max Client Connections |
The maximum number of available client connections. |
||
|
|
Endpoints |
The total number of endpoints configured on the broker. |
||
|
|
Bridges |
The total number of bridges configured on the broker. |
||
|
|
Local Bridges |
The total number of local bridges configured on the broker. |
||
|
|
Remote Bridges |
The total number of remote bridges configured on the broker. |
||
|
|
Remote Bridge Subscriptions |
The total number of remote bridge subscriptions configured on the broker. |
||
|
|
Routing Enabled |
This check box is checked when the broker is configured to route messages to other brokers. |
||
|
|
Routing Interface |
The name of the interface configured to support message routing. |
||
|
|
Total # Conflicting Destinations |
The total number conflicting destinations. |
||
|
|
SpooledSpooledMessages |
The number of spooled messages on the broker. |
||
|
|
Total Client Msgs Rcvd |
The total number of client messages received on the broker. |
||
|
|
Total Client Msgs Sent |
The total number of client messages sent by the broker. |
||
|
|
Total Client Msgs Rcvd/sec |
The total number of client messages received per second by the broker. |
||
|
|
Total Client Msgs Sent/ sec |
The total number of client messages sent by the broker. |
||
|
|
Total Client Bytes Rcvd |
The total number of client bytes received by the broker. |
||
|
|
Total Client Bytes Sent |
The total number of client bytes sent by the broker. |
||
|
|
Total Client Bytes Rcvd/sec |
The total number of client bytes received per second by the broker. |
||
|
|
Total Client Bytes Sent/sec |
The total number of client bytes sent per second by the broker. |
||
|
|
Total Client Direct Msgs Rcvd |
The total number of direct client messages received by the broker. |
||
|
|
Total Client Direct Msgs Sent |
The total number of direct client messages sent from the broker. |
||
|
|
Total Client Direct Msgs Rcvd/sec |
The total number of direct client messages received per second by the broker. |
||
|
|
Total Client Direct Msgs Sent/sec |
The total number of direct client messages sent per second by the broker. |
||
|
|
Total Client Direct Bytes Rcvd |
The total number of direct client bytes received by the broker. |
||
|
|
Total Client Direct Bytes Sent |
The total number of direct client bytes sent by the broker. |
||
|
|
Total Client Direct Bytes Rcvd/sec |
The total number of direct client bytes received per second by the broker. |
||
|
|
Total Client Direct Bytes Sent/sec |
The total number of direct client bytes sent per second by the broker. |
||
|
|
Total Client Non-Persistent Msgs Rcvd |
The total number of non-persistent client messages received by the broker. |
||
|
|
Total Client Non-Persistent Msgs Sent |
The total number of non-persistent client messages sent by the broker. |
||
|
|
Total Client Non-Persistent Msgs Rcvd/sec |
The total number of non-persistent client messages received per second by the broker. |
||
|
|
Total Client Non-Persistent Msgs Sent/ sec |
The total number of non-persistent client messages sent per second by the broker. |
||
|
|
Total Client Non-Persistent Bytes Rcvd |
The total number of non-persistent client bytes received by the broker. |
||
|
|
Total Client Non-Persistent Bytes Sent |
The total number of non-persistent client bytes sent by the broker. |
||
|
|
Total Client Non-Persistent Bytes Rcvd/sec |
The total number of non-persistent client bytes received per second by the broker. |
||
|
|
Total Client Non-Persistent Bytes Sent/sec |
The total number of non-persistent client bytes sent per second by the broker. |
||
|
|
Total Client Persistent Msgs Rcvd |
The total number of persistent client messages received by the broker. |
||
|
|
Total Client Persistent Msgs Sent |
The total number of persistent client messages sent by the broker. |
||
|
|
Total Client Persistent Msgs Rcvd/sec |
The total number of persistent client messages received per second by the broker. |
||
|
|
Total Client Persistent Msgs Sent/ sec |
The total number of persistent client messages sent per second by the broker. |
||
|
|
Total Client Persistent Bytes Rcvd |
The total number of persistent client bytes received by the broker. |
||
|
|
Total Client Persistent Bytes Sent |
The total number of persistent client bytes sent by the broker. |
||
|
|
Total Client Persistent Bytes Rcvd/sec |
The total number of persistent client bytes received per second by the broker. |
||
|
|
Total Client Persistent Bytes Sent/ sec |
The total number of persistent client bytes sent per second by the broker. |
||
|
|
Avg Egress Bytes/min |
The average number of outgoing bytes per minute. |
||
|
|
Avg Egress Compressed Msgs/min |
The average number of outgoing compressed messages per minute. |
||
|
|
Avg Egress Msgs/min |
The average number of outgoing messages per minute. |
||
|
|
Avg Egress SSL Msgs/min |
The average number of outgoing messages per minute being sent via SSL-encrypted connections. |
||
|
|
Avg Egress Uncompressed Msgs/min |
The average number of uncompressed outgoing messages per minute. |
||
|
|
Avg Ingress Bytes/min |
The average number of incoming bytes per minute. |
||
|
|
Avg Ingress Compressed Msgs/min |
The average number of compressed incoming message per minute. |
||
|
|
Avg Ingress Msgs/min |
The average number of incoming messages per minute. |
||
|
|
Average Ingress SSL Msgs/min |
The average number of incoming messages per minute being received via SSL-encrypted connections. |
||
|
|
Avg Ingress Uncompressed Msgs/min |
The average number of uncompressed messages per minute. |
||
|
|
Current Egress Bytes/sec |
The current number of outgoing bytes per second. |
||
|
|
Current Egress Compressed Msgs/sec |
The current number of outgoing compressed messages per second. |
||
|
|
Current Egress Msgs/sec |
The current number of outgoing messages per second. |
||
|
|
Current Egress SSL Msgs/sec |
The current number of outgoing messages per second sent via SSL-encrypted connections. |
||
|
|
Current Egress Uncompressed Msgs/sec |
The current number of outgoing uncompressed messages per second. |
||
|
|
Current Ingress Bytes/sec |
The current number of incoming bytes per second. |
||
|
|
Current Ingress Compressed Msgs/sec |
The current number of incoming compressed messages per second. |
||
|
|
Current Ingress Msgs/sec |
The current number of incoming messages per second. |
||
|
|
Current Ingress SSL Msgs/sec |
The current number of incoming messages per second received via SSL-encrypted connections. |
||
|
|
Current Ingress Uncompressed Msgs/sec |
The current number of incoming uncompressed messages per second. |
||
|
|
Ingress Comp Ratio |
The percentage of incoming messages that are compressed. |
||
|
|
Egress Comp Ratio |
The percentage of outgoing messages that are compressed. |
||
|
|
Egress Compressed Bytes |
The number of outgoing compressed bytes. |
||
|
|
Egress SSL Bytes |
The number of outgoing compressed bytes being sent via SSL-encrypted connections. |
||
|
|
Egress Uncompressed Bytes |
The number of outgoing uncompressed bytes. |
||
|
|
Ingress Compressed Bytes |
The number of incoming compressed bytes. |
||
|
|
Ingress SSL Bytes |
The number of incoming bytes via SSL-encrypted connections. |
||
|
|
Ingress Uncompressed Bytes |
The number of incoming uncompressed bytes. |
||
|
|
Total Egress Discards |
The total number of outgoing messages that have been discarded by the broker. |
||
|
|
Egress Discarded Msgs/sec |
The total number of outgoing messages per second that have been discarded by the broker. |
||
|
|
Total Ingress Discards |
The total number of incoming messages that have been discarded by the broker. |
||
|
|
Total Ingress Discards/sec |
The total number of incoming messages per second that have been discarded by the broker. |
||
|
|
Client Authorization Failures |
The number of failed authorization attempts |
||
|
|
Client Connect Failures (ACL) |
The number of client connection failures caused because the client was not included in the defined access list. |
||
|
|
Subscribe Topic Failures |
The number of failed attempts at subscribing to topics. |
||
|
|
TCP Fast Retrans Sent |
The total number of messages that were retransmitted as a result of TCP Fast Retransmission (one or more messages in a sequence of messages that were not received by their intended party that were sent again). |
||
|
|
Memory (KB) |
The total available memory (in kilobytes) on the broker. |
||
|
|
Memory Free (KB) |
The total amount of available memory (in kilobytes) on the broker. |
||
|
|
Memory Used (KB) |
The total amount of memory used (in kilobytes) on the broker. |
||
|
|
Memory Used % |
The percentage of total available memory that is currently being used. |
||
|
|
Swap (KB) |
The total available swap (in kilobytes) on the broker. |
||
|
|
Swap Free (KB) |
The total amount of available swap (in kilobytes) on the broker. |
||
|
|
Swap Used (KB) |
The total amount of swap used (in kilobytes) on the broker. |
||
|
|
Swap Used % |
The percentage of total available swap that is currently being used. |
||
|
|
Subscription Mem Total (KB) |
The total amount of available memory (in kilobytes) that can be used by queue/topic subscriptions. |
||
|
|
Subscription Mem Free (KB) |
The current amount of available memory (in kilobytes) that can be used by queue/topic subscriptions. |
||
|
|
Subscription Mem Used (KB) |
The current amount of memory (in kilobytes) being used by queue/topic subscriptions. |
||
|
|
Subscription Mem Used % |
The percentage of available memory being used by queue/topic subscriptions. |
||
|
|
Chassis Product Number |
The product number of the chassis in which the broker is contained. |
||
|
|
Chassis Revision |
The revision number of the chassis. |
||
|
|
Chassis Serial |
The serial number of the chassis. |
||
|
|
BIOS Version |
The basic input/output system used by the chassis. |
||
|
|
CPU-1 |
The name of the central processing unit (CPU 1) used by the broker. |
||
|
|
CPU-2 |
The name of the central processing unit (CPU 2) used by the broker. |
||
|
|
Operational Power Supplies |
The number of available power supplies that are operational on the chassis. |
||
|
|
Power Redundancy Config |
The configuration used by the backup broker. |
||
|
|
Max # Bridges |
The maximum number of bridges allowed on the broker. |
||
|
|
Max # Local Bridges |
The maximum number of local bridges allowed on the broker. |
||
|
|
Max # Remote Bridges |
The maximum number of remote bridges allowed on the broker. |
||
|
|
Max # Remote Bridge Subscriptions |
The maximum number of remote bridge subscriptions allowed on the broker. |
||
|
|
Redundancy Config Status |
The status of the redundancy configuration. |
||
|
|
Redundancy Status |
The status of the redundant broker. |
||
|
|
Redundancy Mode |
Refer to Solace documentation for more information. |
||
|
|
Auto-revert |
Refer to Solace documentation for more information. |
||
|
|
Mate Router Name |
If redundancy is configured, this field lists the redundant broker name (mate broker name). |
||
|
|
ADB Link Up |
This check box is checked if a broker is set up to use guaranteed messaging and an Assured Delivery Blade (ADB) is set up and working correctly. |
||
|
|
ADB Hello Up |
Refer to Solace documentation for more information. |
||
|
|
Pair Primary Status |
The primary status of the broker and its redundant (failover) mate. |
||
|
|
Pair Backup Status |
Refer to Solace documentation for more information. |
||
|
|
CPU Cores |
This value is retrieved by the "show system" SEMP request. Refer to Solace documentation for more information. |
||
|
|
Expired |
When checked, performance data about the broker has not been received within the time specified. |
||
|
|
Time Stamp |
The date and time the row of data was last updated. |
||
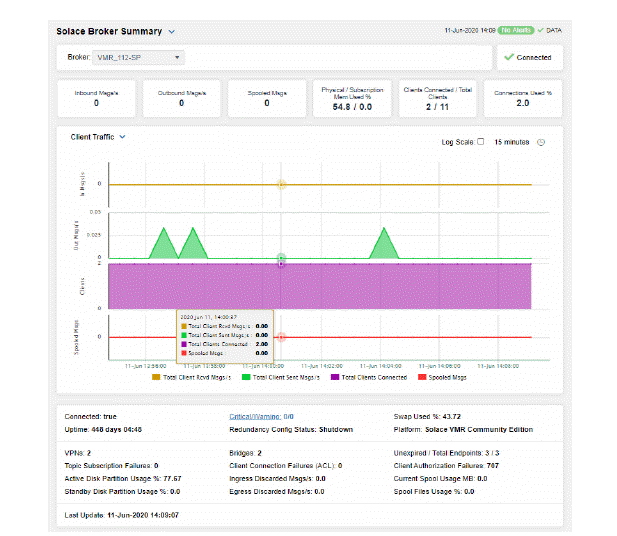
View performance and processing details for a single broker, such as the total Inbound / Outbound Messages per second, Spooled Messages and Clients Connected / Total Clients. The trend graph traces the performance metric you select: Client Traffic, Spool Msgs or Memory.
Choose a broker from the Broker drop-down menu to view its total number of connected clients, number of incoming messages, Up Time, and additional information. You can also view alert statuses and Spool Status data for the broker. You can hover over each area in the upper half of the display to see more detail. You can also drill down to see even more detail by clicking on each metric card.
The bottom half of the display provides current and historical performance metrics for the selected broker, such as connection status and Unexpired / Total Endpoints.
You can hover over the trend graph to see the values at a particular time. You can specify the time range for the trend graph and view data based on a log scale, which enables visualization on a logarithmic scale and should be used when the range in your data is very broad.
|
|


|
The connection status (connected/disconnected). |
||
|
|
Inbound Msgs/s |
The number of messages received per second. |
||
|
|
Outbound Msgs/s |
The number of messages sent per second. |
||
|
|
Spooled Msgs/s |
The number of spooled messages. |
||
|
|
Physical / Subscription Mem Used % |
The total percentage of physical memory used / the total percentage of subscription memory used. |
||
|
|
Clients Connected / Total Clients |
The current number of clients connected / the total number of clients. |
||
|
|
Connections Used % |
The percentage of connections used. |
||
|
Trend Graphs Traces the selected broker. |
||||
|
|
Client Traffic |
|
||
|
|
Spool Msgs |
|
||
|
|
Memory |
Subscription Mem Used % - Traces the percent of memory used by subscriptions. |
||
|
|
Log Scale |
Select to enable a logarithmic scale. Use Log Scale to see usage correlations for data with a wide range of values. For example, if a minority of your data is on a scale of tens, and a majority of your data is on a scale of thousands, the minority of your data is typically not visible in non-log scale graphs. Log Scale makes data on both scales visible by applying logarithmic values rather than actual values to the data. |
||
|
|
Time Settings |
By default, the time range end point is the current time. To change the time range, click the Time Settings
Toggle forward/backward in the trend graph per the period you choose (from the Time range drop-down menu) using arrows Restore settings to current time by selecting now
|
||
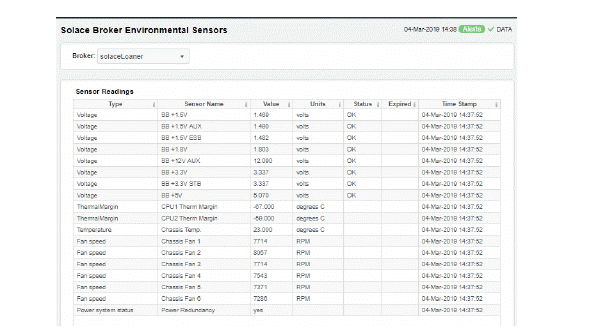
This tabular display contains environmental sensor metrics for a selected broker. Use this display to find out the type, name, value, and status of the sensors. This display only applies to Hardware (HW) Brokers. Note that the drop down menu does not show connection strings to PubSub+ Software Brokers.
Select a HW broker from the drop-down menu. Search by clicking the right side of a column heading/Filter to open the Search, Sort and Choose Columns dialog:

|
Sensor Readings Each row in the table is a different sensor on the broker. |
||||
|
|
Type |
See vendor documentation for details. |
||
|
|
Sensor Name |
The name of the sensor. |
||
|
|
Value |
Lists the value of the sensor. |
||
|
|
Units |
Lists the unit of measure for the sensor. |
||
|
|
Status |
The current status of the sensor. |
||
|
|
Expired |
When checked, performance data about the broker has not been received within the time specified. |
||
|
|
Time Stamp |
The date and time the row of data was last updated. |
||
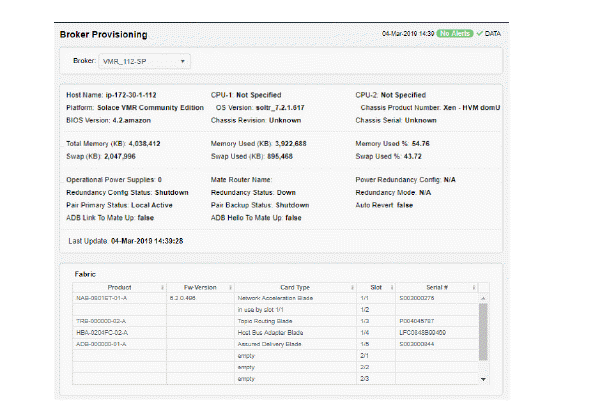
This display shows provisioning metrics for a single broker. Use this to see the host, platform, chassis, memory, operating system version, redundancy and fabric data for a specific broker.
Select a broker from the drop-down menus. Search by clicking the right side of a column heading/Filter to open the Search, Sort and Choose Columns dialog:

|
|
Host Name |
The name of the host. |
||
|
|
Platform |
The platform on which the broker is running. |
||
|
|
Chassis Product # |
The product number of the chassis in which the broker is contained. |
||
|
|
Chassis Revision # |
The revision number of the chassis. |
||
|
|
Chassis Serial # |
The serial number of the chassis. |
||
|
|
Power Configuration |
The power configuration used by the chassis. |
||
|
|
Operational Power Supplies |
The number of available power supplies that are operational on the chassis. |
||
|
|
CPU 1 |
The name of the central processing unit (CPU 1) used by the broker. |
||
|
|
CPU 2 |
The name of the central processing unit (CPU 2) used by the broker. |
||
|
|
BIOS |
The basic input/output system used by the chassis. |
||
|
|
Memory (KB) |
|||
|
|
|
Physical |
Lists the Total amount, the Free amount, the Used amount, and the Used % of physical memory. |
|
|
|
|
Swap |
Lists the Total amount, the Free amount, the Used amount, and the Used % of swap memory. |
|
|
|
Redundancy These fields describe a fault tolerant pair of brokers. |
|||
|
|
|
Mate Router Name |
If redundancy is configured, this field lists the redundant broker name (mate broker name). |
|
|
|
|
Configuration Status |
The status of the configuration for the backup broker. |
|
|
|
|
Redundancy Status |
The status of the redundant broker. |
|
|
|
|
Redundancy Mode |
Refer to Solace documentation for more information. |
|
|
|
|
Primary Status |
The status of the primary broker. |
|
|
|
|
Backup Status |
Refer to Solace documentation for more information. |
|
|
|
|
Auto-Revert |
Refer to Solace documentation for more information. |
|
|
|
|
ADB Link Up |
This check box is checked if a broker is set up to use guaranteed messaging and an Assured Delivery Blade (ADB) is set up and working correctly. |
|
|
|
|
ADB Hello Up |
Refer to Solace documentation for more information. |
|
|
|
Fabric |
|||
|
|
|
Slot |
Displays the slot number on the network switch. |
|
|
|
|
Card Type |
The type of card connected to the particular slot. |
|
|
|
|
Product |
The product associated with the particular slot. |
|
|
|
|
Serial # |
The serial number of the product. |
|
|
|
|
Fw-Version |
The firmware version of the product. |
|
This display lists all network interfaces on a selected broker, and shows network interface status, in/out throughput per second and additional detailed metrics.
Select a broker and interface from the drop-down menus. Each row in the table is a different network interface. Double-click a row to trace its current and historical performance data in the trend graph (bytes in/out and packets in/out per second).
You can hover over the trend graph to see the values at a particular time. You can specify the time range for the trend graph and view data based on a log scale, which enables visualization on a logarithmic scale and should be used when the range in your data is very broad.
Search by clicking the right side of a column heading/Filter to open the Search, Sort and Choose Columns dialog:

|
|
Interface |
The name of the network interface. |
||
|
|
Enabled |
Displays whether or not the network interface is enabled. |
||
|
|
mode |
Describes how the interface is configured to support networking operations. |
||
|
|
Link Up |
Indicates whether the interface is electrically signaling on the transmission medium. |
||
|
|
IN Bytes/sec |
The number of bytes per second contained in incoming messages. |
||
|
|
IN Pkts/sec |
The number of incoming packets per second. |
||
|
|
OUT Bytes/ sec |
The number of bytes per second contained in the outgoing messages. |
||
|
|
OUT Pkts/sec |
The number of outgoing packets per second. |
||
|
Trend Graphs |
||||
|
|
Inbound Pkts/ sec |
Traces the number of incoming packets per second. |
||
|
|
Outbound Bytes/sec |
Traces the number of bytes per second contained in the incoming messages. |
||
|
|
Log Scale |
Select to enable a logarithmic scale. Use Log Scale to see usage correlations for data with a wide range of values. For example, if a minority of your data is on a scale of tens, and a majority of your data is on a scale of thousands, the minority of your data is typically not visible in non-log scale graphs. Log Scale makes data on both scales visible by applying logarithmic values rather than actual values to the data. |
||
|
|
Time Settings |
By default, the time range end point is the current time. To change the time range, click the Time Settings
Toggle forward/backward in the trend graph per the period you choose (from the Time range drop-down menu) using arrows Restore settings to current time by selecting now
|
||
Select a broker from the drop-down menu or select All. This display shows operational status and spooling performance metrics (if spooling is enabled on the broker) for one or all brokers.
Search by clicking the right side of a column heading/Filter to open the Search, Sort and Choose Columns dialog:
Refer to Solace documentation for details about data in this display.
|
|
Count |
The number of brokers that are using spooling in the table. |
||
|
|
Connection |
The connection string associated with the broker. |
||
|
|
Config Status |
The message spool configuration status. |
||
|
|
Operational Status |
The operational status of the message spool. |
||
|
|
Current Spool Usage (MB) |
The current amount of spool used in megabytes on the broker (calculated by summing spool used for each endpoint). |
||
|
|
Msg Spool Used By Queue |
The amount of spool used by queue. |
||
|
|
Msg Spool Used By DTE |
The amount of spool used by DTE. |
||
|
|
Message Count % Utilization |
The percentage messages that use the message spool. |
||
|
|
Delivered UnAcked Msgs % Utilization |
The percentage of unacknowledged messages delivered from the message spool. |
||
|
|
Ingress Flow Count |
The current incoming flow count. |
||
|
|
Ingress Flows Allowed |
The number of incoming flows allowed. |
||
|
|
Topic Subscriptions on Queue Used |
The number of queue/topic subscriptions used. |
||
|
|
Max Topic Subscriptions on Queue |
The maximum number of queue/topic subscriptions available. |
||
|
|
Sequenced Topics Used |
The number of sequenced topics used. |
||
|
|
Max Sequenced Topics |
The maximum number of sequenced topics available. |
||
|
|
Spool Files Used |
The number of spool files used. |
||
|
|
Spool Files Available |
The maximum number of spool files available. |
||
|
|
Spool Files % Utilization |
The percentage of available spool files that have been used. |
||
|
|
Active Disk Partition % Usage |
The percentage of active disk partition that has been used. |
||
|
|
Standby Disk Partition % Usage |
The percentage of standby disk partition that has been used. |
||
|
|
Disk Usage Current (MB) |
The current amount of spool disk usage in megabytes. |
||
|
|
Disk Usage Max (MB) |
The maximum amount of spool disk usage in megabytes. |
||
|
|
Transacted Sessions Used |
The current number of transacted sessions. |
||
|
|
Transacted Sessions Max |
The maximum number of transacted sessions . |
||
|
|
Transacted Session Count % Utilization |
The percentage of transacted sessions that have been used. |
||
|
|
Transacted Session Resource % Utilization |
The percentage of transacted session resources that have been used. |
||
|
|
Expired |
When checked, performance data about the broker has not been received within the time specified. |
||


 .
.

 .
. .
.


 .
.

 .
. .
.
 .
.
 .
. .
.