These displays provide current broker capacity metrics, alert count and severity at the broker level. Displays in this View are:
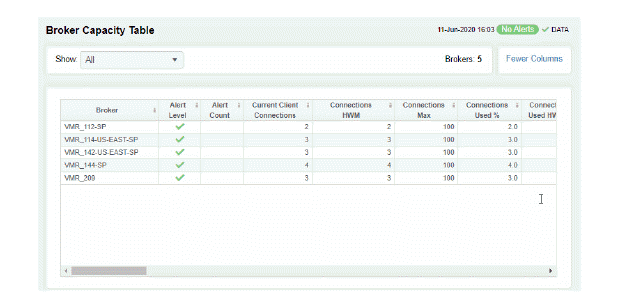
Broker Capacity Table: View client, spool usage, incoming messages, outgoing messages, incoming bytes, and outgoing bytes data for all brokers.
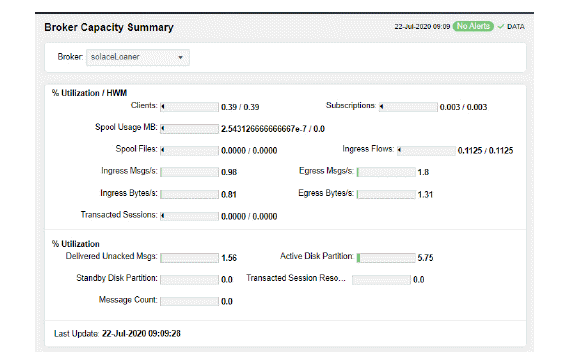
Broker Capacity - Summary: View client, spool usage, incoming messages, outgoing messages, incoming bytes, and outgoing bytes data for a specific broker.
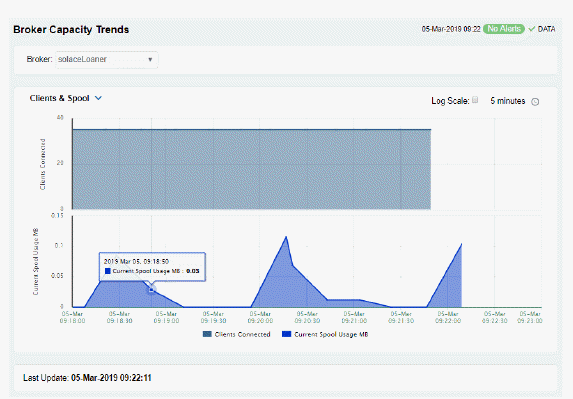
Broker Capacity Trends: View the broker capacity data for a specific broker in a trend graph format.
View current and HWM (high water mark for the last 30 days) capacity utilization data for all brokers. By default, a subset of available metrics is shown. Use More Columns/Less Columns to toggle to the complete set of metrics available (and back to the subset).
You can view client, spool usage, incoming message, outgoing message, incoming bytes, and outgoing bytes data for the broker. Each table row is a different broker.
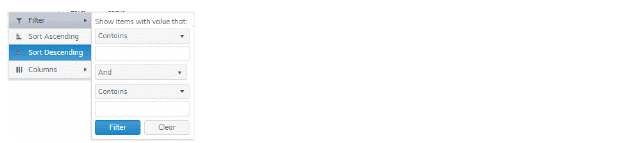
Search by clicking the right side of a column heading/Filter to open the Search, Sort and Choose Columns dialog:
Double-click a row to drill down and investigate in the Broker Capacity - Summary display.
|
|
Broker |
The name of the broker. |
||
|
|
Alert Level |
The maximum level of alerts in the row:
|
||
|
|
Alert Count |
The total number of active alerts. |
||
|
|
Current Client Connections |
The current number of clients connected. |
||
|
|
Connections HWM |
The greatest number of connections in the last 30 days. |
||
|
|
Connections Max |
The greatest number of connections since the broker last started. |
||
|
|
Connections Used % |
The current amount of connections used, in percent. |
||
|
|
Connections Used HWM % |
The greatest amount of connections used, in percent, in the last 30 days. |
||
|
|
Cur Spool Usage MB |
The current amount of used spool disk, in megabytes. |
||
|
|
Cur Spool Usage HWM |
The greatest amount of spool disk used in the last 30 days. |
||
|
|
Spool Size Max MB |
The amount of allocated spool disk. |
||
|
|
Current Spool Usage % |
The current amount of used spool disk, in percent. |
||
|
|
Current Spool Usage % HWM |
The greatest amount of used spool disk in the last 30 days, in percent. |
||
|
|
Delivered Unacked Msgs Util % |
Refer to Solace documentation for more information. |
||
|
|
Ingress Flow Count |
The number of ingress flows. |
||
|
|
Ingress Flow HWM |
The greatest number of ingress flows in the last 30 days. |
||
|
|
Ingress Flows Allowed |
The maximum number of ingress flows allowed. |
||
|
|
Ingress Flow Count % |
The amount of ingress flows in percent. |
||
|
|
Ingress Flow Count HWM % |
The greatest amount of ingress flows in the last 30 days, in percent. |
||
|
|
Ingress Msgs/s |
The number of ingress messages per second. |
||
|
|
Ingress Msgs/s HWM |
The greatest number of ingress messages per second in the last 30 days. |
||
|
|
Cur Egress Msgs/s |
The number of egress messages per second. |
||
|
|
Egress Msgs/s HWM |
The greatest number of egress messages per second in the last 30 days. |
||
|
|
Egress Bytes/s HWM |
The greatest amount of egress, in bytes per second, in the last 30 days, in percent. |
||
|
|
Time Stamp |
The date and time the row of data was last updated. |
||
This display, a pivoted view of the Broker Capacity Table, allows you to view current and HWM (high water mark for the last 30 days) capacity utilization data for a single broker. Current values are represented by the green bar next to each field. Select a broker from the drop-down menu to view client, spool usage, incoming message, outgoing message, incoming bytes, and outgoing bytes data for the broker. You can mouse over to see rate-per-second values for Egress and Ingress Bytes/s and Egress and Ingress Msgs/s.
|
|
% Utilization/HWM |
The following fields show two values: the current % (percent) utilization / peak capacity utilization (HWM) for the last 30 days. HWM values are represented by the black triangular pointer on a bar that reads from 0 to 100%. |
||
|
|
|
Clients |
The clients connected to the broker. |
|
|
|
|
Spool Files |
The number of spool files on the broker. |
|
|
|
|
Egress Msgs/s |
The outgoing messages per second for the broker. |
|
|
|
|
Transacted Sessions |
The number of transacted sessions on the broker. |
|
|
|
|
Subscriptions |
The number of subscriptions on the broker. |
|
|
|
|
Ingress Flows |
The number of inflows on the broker. |
|
|
|
|
Ingress Bytes/s |
The incoming bytes per second for the broker. |
|
|
|
|
Spool Usage MB |
The amount of spool utilization, in megabytes per second, for the broker. |
|
|
|
|
Ingress Msgs/s |
The incoming messages per second for the broker. |
|
|
|
|
Egress Bytes/s |
The outgoing bytes per second for the broker. |
|
|
|
% Utilization |
The following fields show current capacity % utilization. |
||
|
|
|
Delivered Unacked Msgs |
The current number of delivered messages that were not acknowledged divided by the maximum number of delivered messages that were not acknowledged allowed on the broker. |
|
|
|
|
Transacted Sessions Reso... |
The current number of transacted sessions that were resolved on the broker. |
|
|
|
|
Active Disk Partition |
The percentage of available active disk partition that is used. |
|
|
|
|
Message Count |
The current number of messages on the broker. |
|
|
|
|
Standby Disk Partition |
The percentage of available standby disk partition that has been used. |
|
|
|
|
|
|
|
|
|
|
Last Update |
The date and time of the last data update. |
|
This display allows you to view a trend graph that traces broker performance data for clients & spool data, message flow and throughput. Select a broker and a performance metric from the drop-down menus.
|
|
||||
|
|
Clients & Spool |
The trend graph traces the following performance metrics: Clients Connected: The current number of clients connected to the broker. Current Spool Usage: The current spool usage, in megabytes, on the broker. |
||
|
|
Message Flow |
The trend graph traces the following: Ingress Msgs/sec: The number of incoming messages per second on the broker. Egress Msgs/sec: The number of outgoing messages per second on the broker. |
||
|
|
Throughput |
The trend graph traces the following: Ingress KB/sec: The amount of incoming per second, in KB, on the broker. Egress KB/sec: The number of outgoing data per second, in KB, on the broker. |
||
|
|
Log Scale |
Select to enable a logarithmic scale. Use Log Scale to see usage correlations for data with a wide range of values. For example, if a minority of your data is on a scale of tens, and a majority of your data is on a scale of thousands, the minority of your data is typically not visible in non-log scale graphs. Log Scale makes data on both scales visible by applying logarithmic values rather than actual values to the data. |
||
|
|
Base at Zero |
Select to use zero (0) as the Y axis minimum for all graph traces. |
||
|
|
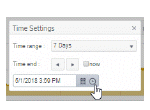
Time Settings |
By default, the time range end point is the current time. To change the time range, click the Time Settings
Toggle forward/backward in the trend graph per the period you choose (from the Time range drop-down menu) using arrows Restore settings to current time by selecting now
|
||


 .
.
 .
. .
.