The Solace Syslog Events displays allows you to supervise the last Syslog event messages from the Solace Message Brokers that have been configured for Syslog monitoring. See Solace product documentation for an in depth description of Syslog monitoring in Solace products and how to configure Message Brokers and the Syslog destination.
These displays require the Solace Event Module from the RTView Solace Monitor to be properly configured with a Syslog destination and running. Displays in this View are:
Syslog Events Table: A tabular view of all available data for all Syslog events configured on a specific broker.
Syslog Event Summary: Expanded/Summary information for a single Syslog event.
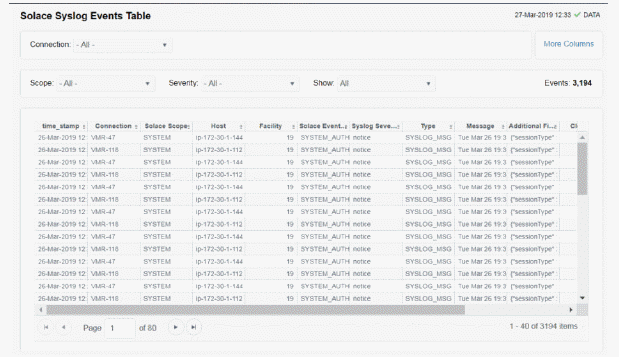
This display lists all Syslog events collected from all Solace brokers. Each row in the table is a different message. Use the drop-down menus to filter the list by Connection, Scope and alert Severity level. Filter messages per single broker or all brokers. Click a column header to sort column data in numerical, alphabetical or chronological order. Click a row to investigate the Syslog event in the Syslog Event Summary display.
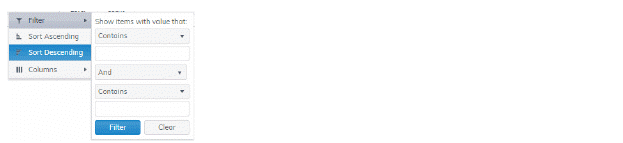
Search by clicking the right side of a column heading/Filter to open the Search, Sort and Choose Columns dialog:
|
|
Connection |
Select the connection string assigned when the message brokers connection properties were added with the RTView Configuration Application. |
||
|
|
More/Fewer Columns |
Switches to another syslog events table display containing the full set of columns coming from Syslog. |
||
|
|
Scope: |
This drop down selects the type of the event. The SYSTEM events are coming from conditions related to the state of the message broker. VPN events are events with the state of the message brokers VPNs. CLIENT events refer to the state of clients executions in the messaging infrastructure. Available options are:
|
||
|
|
Severity: |
Selects the severity level of the events that will be presented in the table. All options go from the less severe to the most important to the health of the systems unless one specifies one single type of severity. For instance, Warning will only show the events that are defined as Warning, filtering out events more damaging, whereas Warning or higher will show all Syslog events that are either Warning, Error, Alert or Emergency. To avoid missing any key event, selection of Warning or higher is recommended. Available options are:
|
||
|
|
Show: |
Selects the Expiration flag of the event. Due to the large number of events that can exist, it is recommended to select Unexpired Only to see exclusively the events that are active. Available options are:
|
||
|
|
Events: |
The number of events currently shown in the table. |
||
|
|
Time Stamp |
The date and time the row of data was last updated. |
||
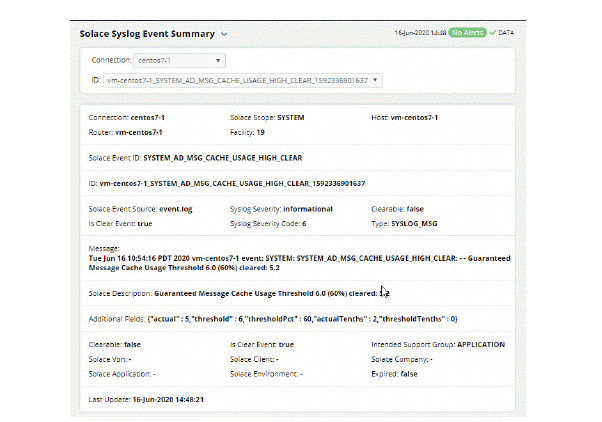
View status and configuration details for a single Syslog Event, such as the Syslog Severity Code, the Intended Support Group, and whether the event is Clearable and Expired.
Select a Connection and an ID from the drop-down menus.
Refer to Solace product documentation for additional information about values provided in this display.
|
|
Connection: |
Select a connection. |
||
|
|
ID: |
Select an event ID. |
||
|
|
Connection |
The name of the selected connection. |
||
|
|
Router |
The name of the router for the selected event. |
||
|
|
Solace Scope |
The type of Syslog event:
|
||
|
|
Facility |
The generating facility for the event. Event broker Syslog messages belong to a facility, which is a group of messages that are either generated by the same software process, or concern a similar event broker subsystem condition or activity (such as debugging attempts). |
||
|
|
Host |
The name of the host associated with the event. |
||
|
|
Solace Event ID |
The type of Solace event. |
||
|
|
ID |
The unique identifier for the event. |
||
|
|
Solace Event Source |
The name of the log file in which the event is recorded. |
||
|
|
Is Clear Event |
true/false |
||
|
|
Syslog Severity: |
The Syslog severity level for the event: 0 - Emergency: system is unusable. 1 - Alert: action must be taken immediately. 2 - Critical: critical conditions. 3 - Error: error conditions. 4 - Warning: warning conditions. 5 - Notice: normal but significant condition. 6 - Informational: informational messages. 7 - Debug: debug-level messages. |
||
|
|
Syslog Severity Code: |
0 - Emergency: system is unusable. 1 - Alert: action must be taken immediately. 2 - Critical: critical conditions. 3 - Error: error conditions. 4 - Warning: warning conditions. 5 - Notice: normal but significant condition. 6 - Informational: informational messages. 7 - Debug: debug-level messages. |
||
|
|
Clearable: |
true/false |
||
|
|
Type: |
The type of the selected event. |
||
|
|
Message: |
The Syslog message content. |
||
|
|
Solace Description |
The Message Text for this event. |
||
|
|
Additional Fields |
Additional information associated with the event (formatted as Name:Value pairs in a JSON object). |
||
|
|
Clearable |
true/false |
||
|
|
Solace Vpn |
The Solace VPN identifier associated with this event. |
||
|
|
Solace Application |
The Solace Application identifier associated with this event. |
||
|
|
Is Clear Event |
true/false |
||
|
|
Solace Client |
The Solace Client identifier associated with this event. |
||
|
|
Solace Environment |
The Solace environment identifier associated with this event . |
||
|
|
Intended Support Group |
The intended support group for this event. |
||
|
|
Solace Company |
The Solace Company identifier associated with this event. |
||
|
|
Expired |
true/false |
||
|
|
Last Update |
The date and time of the last data update. |
||