 to include or exclude non-operational VPNs in the heatmap. Use the Log Scale and Auto Scale check-boxes
  to apply log or auto scale. Use the Show Broker check-box
  to include or exclude broker names in the heatmap.
You can view data for all VPNs configured on a specific broker in heatmap, table, or grid formats, or you can view data for a single VPN. Displays in this View are:
VPNs Heatmap: A color-coded heatmap view of the current status of all VPNs configured on a specific broker.
VPNs Table: A tabular view of all available data for all VPNs configured on a specific broker.
VPNs Summary: Current and historical metrics for a single VPN.
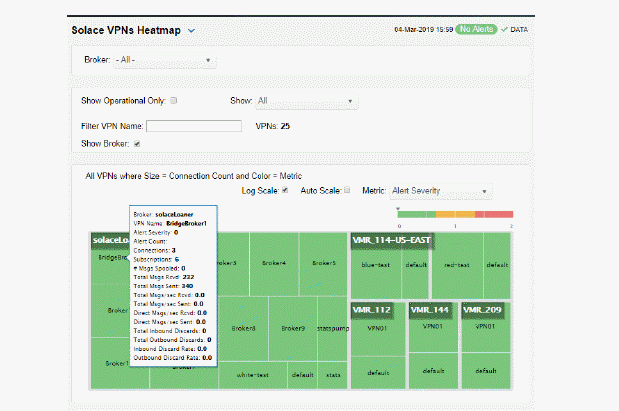
View the status of all VPNs configured on a specific broker in a heatmap format, which allows you to quickly identify VPNs with critical alerts. Each rectangle in the heatmap represents a VPN. The rectangle color indicates the alert state and rectangle size represents the number of connections.
Select a broker from the Broker drop-down menu, or enter a search string in the Filter VPN Name field, and select a metric from the Metric drop-down menu. Use the Show Operational Only check-box to include or exclude non-operational VPNs in the heatmap. Use the Log Scale and Auto Scale check-boxes to apply log or auto scale. Use the Show Broker check-box to include or exclude broker names in the heatmap.
By default, this display shows Alert Severity, but you can mouse over a rectangle to see additional metrics. Drill down and investigate by clicking a rectangle in the heatmap to view details for the selected application in the VPNs Summary display.
|
|
Operational |
When checked, only shows operational brokers. |
||
|
|
Filter VPN Name |
Enter a string to show only VPNs with this string in their name. |
||
|
|
Metric |
Choose a metric to view in the display. |
||
|
|
|
Alert Severity |
Visually displays the level at which the VPN has or has not exceeded its alarm level threshold. Values range from 0 - 2, as indicated in the color gradient
|
|
|
|
|
Alert Count |
The total number of critical and warning alerts. The color gradient |
|
|
|
|
Connections |
The total number of connections. The color gradient When Auto is checked, the numeric values in the color gradient bar show the range of the data being displayed rather than the default values. The middle value changes accordingly to indicate the color of the middle value of the range. |
|
|
|
|
Subscriptions |
The total number of subscriptions. The color gradient When Auto is checked, the numeric values in the color gradient bar show the range of the data being displayed rather than the default values. The middle value changes accordingly to indicate the color of the middle value of the range. |
|
|
|
|
# Msgs Spooled |
The total number of spooled messages. The color gradient When Auto is checked, the numeric values in the color gradient bar show the range of the data being displayed rather than the default values. The middle value changes accordingly to indicate the color of the middle value of the range. |
|
|
|
|
Total Msgs Rcvd |
The total number of received messages. The color gradient The Auto flag does not impact this metric. |
|
|
|
|
Total Msgs Sent |
The total number of sent messages. The color gradient The Auto flag does not impact this metric. |
|
|
|
|
Total Msgs/ sec Rcvd |
The number of messages received per second. The color gradient When Auto is checked, the numeric values in the color gradient bar show the range of the data being displayed rather than the default values. The middle value changes accordingly to indicate the color of the middle value of the range. |
|
|
|
|
Total Msgs/ sec Sent |
The number of messages sent per second. The color gradient When Auto is checked, the numeric values in the color gradient bar show the range of the data being displayed rather than the default values. The middle value changes accordingly to indicate the color of the middle value of the range. |
|
|
|
|
Total Bytes/ sec Rcvd |
The number of bytes contained in messages received per second. The color gradient When Auto is checked, the numeric values in the color gradient bar show the range of the data being displayed rather than the default values. The middle value changes accordingly to indicate the color of the middle value of the range. |
|
|
|
|
Total Bytes/ sec Sent |
The number of bytes contained in direct messages sent per second. The color gradient When Auto is checked, the numeric values in the color gradient bar show the range of the data being displayed rather than the default values. The middle value changes accordingly to indicate the color of the middle value of the range. |
|
|
|
|
Direct Msgs/sec Rcvd |
The number of direct messages received per second. The color gradient The Auto flag does not impact this metric. |
|
|
|
|
Direct Msgs/sec Sent |
The number of direct messages sent per second in the heatmap rectangle. The color gradient The Auto flag does not impact this metric. |
|
|
|
|
Total Inbound Discards |
The total number of discarded inbound messages in the heatmap rectangle. The color gradient The Auto flag does not impact this metric. |
|
|
|
|
Total Outbound Discards |
The total number of discarded outbound messages in the heatmap rectangle. The color gradient The Auto flag does not impact this metric. |
|
|
|
|
Inbound Discard Rate |
The number of discarded inbound messages per second in the heatmap rectangle. The color gradient When Auto is checked, the numeric values in the color gradient bar show the range of the data being displayed rather than the default values. The middle value changes accordingly to indicate the color of the middle value of the range. |
|
|
|
|
Outbound Discard Rate |
The number of discarded outbound messages per second in the heatmap rectangle. The color gradient When Auto is checked, the numeric values in the color gradient bar show the range of the data being displayed rather than the default values. The middle value changes accordingly to indicate the color of the middle value of the range. |
|
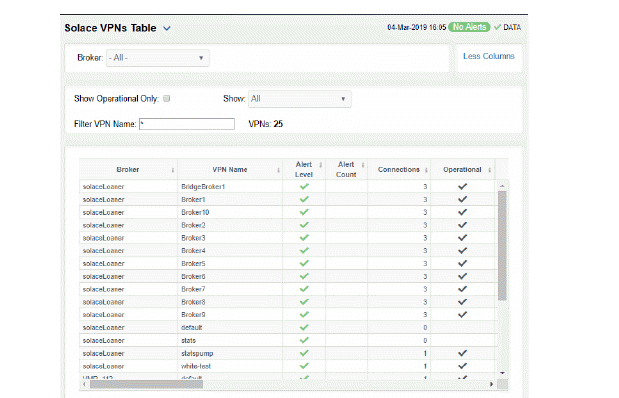
View data shown in the VPNs Heatmap display, as well as additional details, in a tabular format. Use this display to view all available data for each VPN associated with a specific broker.
By default, a subset of available metrics is shown. Use More Columns/Less Columns to toggle to the complete set of metrics available (and back to the subset).
Select a broker from the Broker drop-down menu. Each table row is a different VPN associated with the broker. Click a column header to sort column data in numerical or alphabetical order.
Sort data in numerical or alphabetical order on column headers. Use the check-box  to include / exclude non-operational VPNs. Use the Show drop-down to see All VPNs, Expired Only or Unexpired Only. Enter a string in the Filter VPN Name field to show only VPNs with this string in their name.
Search by clicking the right side of a column heading/Filter to open the Search, Sort and Choose Columns dialog:

Double-click a row to drill down and investigate in the VPNs Summary display.
|
|
Broker |
The name of the broker. |
||
|
|
VPN Name |
The name of the VPN. |
||
|
|
Alert Level |
The maximum level of alerts in the row:
|
||
|
|
Alert Count |
The total number of active alerts for the VPN. |
||
|
|
Connections |
The total number of connections for the VPN. |
||
|
|
Operational |
When checked, this status indicates that the VPN is enabled and is operating normally. |
||
|
|
Total Unique Subscriptions |
The total number of unique subscriptions to the VPN. |
||
|
|
Total Client Messages Rcvd |
The total number of messages received from clients connected to the VPN. |
||
|
|
Total Client Messages Sent |
The total number of messages sent to clients connected to the VPN. |
||
|
|
Total Client Bytes Rcvd |
The total number of bytes contained in messages received from clients connected to the VPN. |
||
|
|
Total Client Bytes Sent |
The total number of bytes contained in messages sent to clients connected to the VPN. |
||
|
|
Total Client Msgs/sec Rcvd |
The total number of messages received per second from clients connected to the VPN. |
||
|
|
Total Client Msgs /sec Sent |
The total number of messages sent per second to clients connected to the VPN. |
||
|
|
Total Client Bytes/sec Rcvd |
The total number of bytes contained in messages received per second from clients connected to the VPN. |
||
|
|
Total Client Bytes/sec Sent |
The total number of bytes contained in messages sent per second to clients connected to the VPN. |
||
|
|
Client Direct Msgs Rcvd |
The total number of direct messages received from clients connected to the VPN. |
||
|
|
Client Direct Msgs Sent |
The total number of direct messages sent to clients connected to the VPN. |
||
|
|
Client Direct Bytes Rcvd |
The total number of bytes contained in direct messages received from clients connected to the VPN. |
||
|
|
Client Direct Bytes Sent |
The total number of bytes contained in direct messages sent to clients connected to the VPN. |
||
|
|
Client Direct Msgs/sec Rcvd |
The total number of direct messages received per second from clients connected to the VPN. |
||
|
|
Client Direct Msgs/sec Sent |
The total number of direct messages sent per second to clients connected to the VPN. |
||
|
|
Client Direct Bytes/sec Rcvd |
The total number of bytes contained in the direct messages received per second from clients connected to the VPN. |
||
|
|
Client Direct Bytes/sec Sent |
The total number of bytes contained in the direct messages sent per second to clients connected to the VPN. |
||
|
|
Client NonPersistent Msgs Rcvd |
The total number of non-persistent messages received from clients connected to the VPN. |
||
|
|
Client NonPersistent Msgs Sent |
The total number of non-persistent messages sent to clients connected to the VPN. |
||
|
|
Client NonPersistent Bytes Rcvd |
The total number of bytes contained in the non-persistent messages received from clients connected to the VPN. |
||
|
|
Client NonPersistent Bytes Sent |
The total number of bytes contained in the non-persistent messages sent per second to clients connected to the VPN. |
||
|
|
Client NonPersistant Msgs/sec Rcvd |
The total number of non-persistent messages received per second from clients connected to the VPN. |
||
|
|
Client NonPersistent Msgs/sec Sent |
The total number of non-persistent messages sent per second to clients connected to the VPN. |
||
|
|
Client NonPersistant Bytes/sec Rcvd |
The total number of bytes contained in the non-persistent messages received per second from clients connected to the VPN. |
||
|
|
Client NonPersistent Bytes/sec Sent |
The total number of bytes contained in the non-persistent messages sent per second to clients connected to the VPN. |
||
|
|
Client Persistent Msgs Rcvd |
The total number of persistent messages received from clients connected to the VPN. |
||
|
|
Client Persistent Msgs Sent |
The total number of persistent messages sent to clients connected to the VPN. |
||
|
|
Client Persistent Bytes Rcvd |
The total number of bytes contained in persistent messages received from clients connected to the VPN. |
||
|
|
Client Persistent Bytes Sent |
The total number of bytes contained in persistent messages sent to clients connected to the VPN. |
||
|
|
Client Persistent Msgs/sec Rcvd |
The total number of persistent messages received per second from clients connected to the VPN. |
||
|
|
Client Persistent Msgs/sec Sent |
The total number of persistent messages sent per second to clients connected to the VPN. |
||
|
|
Client Persistent Bytes/sec Rcvd |
The total number of bytes contained in the persistent messages received per second from clients connected to the VPN. |
||
|
|
Client Persistent Bytes/sec Sent |
The total number of bytes contained in the persistent messages sent per second to clients connected to the VPN. |
||
|
|
Total In Discards |
The total number of discarded incoming messages. |
||
|
|
Total In Discards/sec |
The number of discarded incoming messages per second. |
||
|
|
Total Out Discards |
The total number of discarded outgoing messages. |
||
|
|
Total Out Discards/sec |
The number of discarded outgoing messages per second. |
||
|
|
Max Spool Usage (MB) |
The maximum amount of disk storage (in megabytes) that can be consumed by all spooled message on the VPN. |
||
|
|
Authentication Type |
The defined authentication type on the VPN. |
||
|
|
Expired |
When checked, performance data about the broker has not been received within the time specified. |
||
|
|
Time Stamp |
The date and time the row data was last updated. |
||
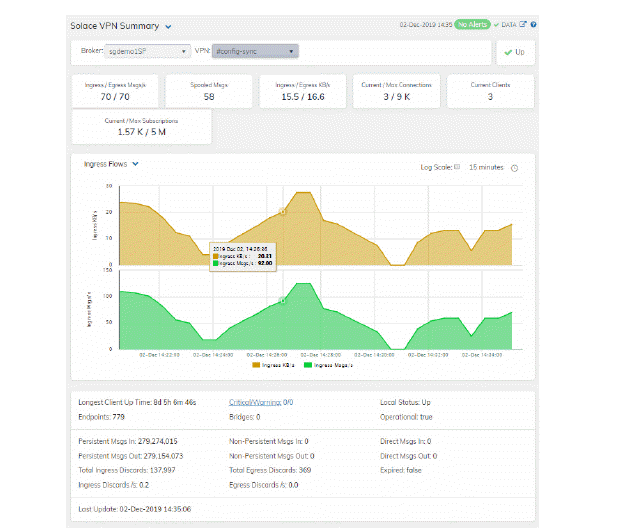
View neighbor broker current configuration details and message throughput rates.
Select a broker and a neighbor broker from the drop down menus. Check message throughput rates to the neighbor broker, as well as neighbor Up Time, State, Data Port, number of connections and link costs.
You can hover over the metric cards to see more performance metrics and also drill down to see even more detail by clicking on them.
The bottom half of the display provides current and historical performance metrics for the selected broker. The trend graph traces the performance metric you select: Ingress Flows, Egress Flows or Spool Msgs.
You can hover over the trend graph to see the values at a particular time. You can specify the time range for the trend graph and view data based on a log scale, which enables visualization on a logarithmic scale and should be used when the range in your data is very broad.
|
|
Alerts |
|
||
|
|
Up |
|
||
|
|
Inbound/Outbound Msgs/s |
The number of inbound/outbound messages per second. |
||
|
|
Spooled Msgs |
The number of spooled messages. |
||
|
|
Inbound/Outbound KB/s |
The number of inbound/outbound messages in KBs per second. |
||
|
|
Current/Max Connections |
The total number of current connections / maximum number of supported connections for the VPN. |
||
|
|
Current Clients |
The number of connected clients. |
||
|
|
Current/Max Subscriptions |
The total number of current subscribers and maximum number of supported subscribers for the VPN. |
||
|
Inbound Msgs/s Trend Graphs Traces the sum of inbound message processing for the selected VPN.
|
||||
|
|
Log Scale |
Select to enable a logarithmic scale. Use Log Scale to see usage correlations for data with a wide range of values. For example, if a minority of your data is on a scale of tens, and a majority of your data is on a scale of thousands, the minority of your data is typically not visible in non-log scale graphs. Log Scale makes data on both scales visible by applying logarithmic values rather than actual values to the data. |
||
|
|
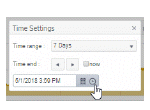
Time Settings |
By default, the time range end point is the current time. To change the time range, click the Time Settings
Toggle forward/backward in the trend graph per the period you choose (from the Time range drop-down menu) using arrows Restore settings to current time by selecting now
|
||
|
|
Longest Client Up Time |
The number of days, hours and minutes for the longest, currently active, client connection. |
||
|
|
Endpoints |
The number of endpoints. |
||
|
|
Persistent Msgs In |
The total number of incoming persistent messages. |
||
|
|
Persistent In Msgs/s |
The number of incoming persistent messages per second. |
||
|
|
Persistent Msgs Out |
The total number of outgoing persistent messages. |
||
|
|
Persistent Out Msgs/s |
The number of outgoing persistent messages per second. |
||
|
|
Total In Discards |
The total number of incoming messages that were discarded. |
||
|
|
Total In Discards/sec |
The total number of incoming messages that were discarded, per second. |
||
|
|
Critical/Warning |
The number of critical alerts / warning alerts which also opens the Alerts Table. |
||
|
|
Bridges |
The number of bridges. |
||
|
|
Non-Persistent Msgs In |
The total number of incoming non-persistent messages. |
||
|
|
Non-Persistent In Msgs/s |
The number of incoming non-persistent messages per second. |
||
|
|
Non-Persistent Msgs Out |
The total number of outgoing non-persistent messages. |
||
|
|
Non-Persistent Out Msgs/s |
The number of outgoing non-existent messages per second. |
||
|
|
Total Out Discards |
The total number of outgoing messages that were discarded. |
||
|
|
Total Out Discards/sec |
The total number of outgoing messages that were discarded, per second.
|
||
|
|
Direct Msgs In |
The total number of incoming direct messages. |
||
|
|
Direct In Msgs/s |
The number of incoming direct messages per second. |
||
|
|
Direct Msgs Out |
The total number of outgoing direct messages. |
||
|
|
Direct Out Msgs/s |
The number of outgoing direct messages per second. |
||
|
|
Expired |
When true, performance data about the VPN has not been received within the time specified. |
||
|
|
Last Update |
The date and time of the last data update. |
||


 .
.
 .
. .
.