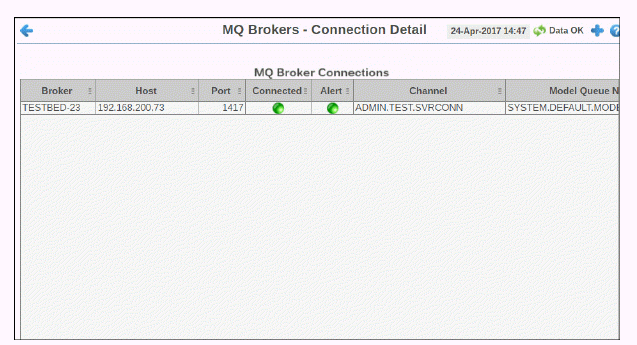
View connection performance details for each MQ Broker in a tabular format, including current status, greatest alert severity and wait time to connect. Each row in the table is a different MQ Broker. Inactive brokers are shown in dark red.
Drill-down and investigate by clicking a row in the table to view details for the selected connection in the Single Broker Summary display.
|
Table Each table row is a different connection. Column values describe the connection except where noted. |
||
|
|
Broker |
The name of the broker. |
|
|
Host |
The name of the host. |
|
|
Port |
The port number used. |
|
|
Connected |
The current connection state:
|
|
|
Alert |
The current alert severity:
|
|
|
Channel |
The name of the channel. |
|
|
Model Queue Name |
Named model queue of the connection. |
|
|
Max Retries |
Maximum number of subsequent connection retry attempts. |
|
|
Retry Interval |
Minimum interval (in seconds) between connection retry attempts. |
|
|
Wait Interval |
Wait interval (in seconds) between attempts to create a connection. |
|
|
conn |
The name of the connection. |
|
|
time_stamp |
The data and time of the last data update. |


