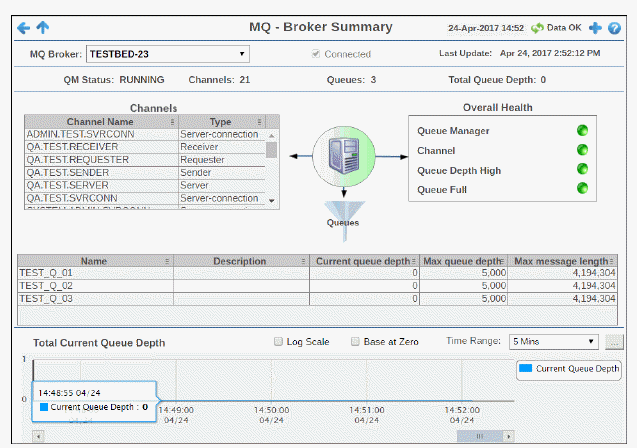
View detailed utilization metrics and health for a single MQ Broker, such as Channel and Queue health and the number of channels per broker.
Use this display to investigate the performance and health of a broker.
Choose a broker from the drop-down menu. Click a row in the Channels table to investigate in the All Channels Table display. Click a row in the Queues table. to investigte in the All Queues Table display.
The trend graph traces the total Current Queue Depth for the selected broker. .


|
Filter By: |
||
|
|
MQ Broker |
Choose a broker to display. |
|
Fields and Data All values describe the selected broker except where noted. |
||
|
|
Connected |
When checked, the broker is connected. |
|
|
Last Update |
The data and time of the last data update. |
|
|
QM Status |
The queue manager status. For example: RUNNING - The QM is operating properly. |
|
|
Channels |
The current number of channels on the broker. |
|
|
Queues |
The current number of queues on the broker. |
|
|
Total Queue Depth |
The total depth of all queues combined. |
|
|
Channels |
Lists the channels on the broker. |
|
|
|
Channel Name: The name of the channel. |
|
|
|
Type: The type of channel (for example, Receiver, Cluster-sender, etc.) |
|
|
Overall Health |
The current alert severity for the broker Queue Manager, Channel, Queue Depth High and Queue Full:
|
|
|
Queues |
Each row is a different queue on the broker. Column values describe the queue. |
|
|
|
Name: The name of the queue. |
|
|
|
Description: A textual description of the queue. |
|
|
|
Current queue depth: The current queue depth. |
|
|
|
Max queue depth: The maximum queue depth. |
|
|
|
Max message length: The maximum message length in the queue. |
|
Trend Graph |
||
|
|
Log Scale |
Select to enable a logarithmic scale. Use Log Scale to see usage correlations for data with a wide range of values. For example, if a minority of your data is on a scale of tens, and a majority of your data is on a scale of thousands, the minority of your data is typically not visible in non-log scale graphs. Log Scale makes data on both scales visible by applying logarithmic values rather than actual values to the data. |
|
|
Base at Zero |
Select to use zero as the Y axis minimum for all graph traces. |
|
|
Time Range |
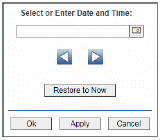
Select a time range from the drop down menu varying from 2 Minutes to Last 7 Days, or display All Data. To specify a time range, click Calendar 
By default, the time range end point is the current time. To change the time range end point, click Calendar Use the navigation arrows Click Restore to Now to reset the time range end point to the current time.
|