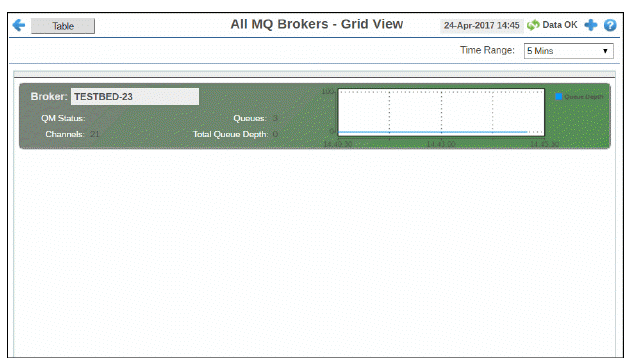
Track current and historical utilization and performance trends of all MQ Brokers in parallel. Use this display to quickly identify hosts with performance issues and verify whether the load is distributed evenly across brokers.
Each grid object is a different MQ Broker. Inactive brokers are shown in dark red, active brokers are shown in green. Metrics include QM status, queue depth and the number of channels per broker.
This display contains data obtained from IBM MQ. For example, MQIACH_HB_INTERVAL, MQIA_MONITORING_CHANNEL and MQIACH_MSG_COMPRESSION. For details, refer to vendor documentation.
Choose a time range to display from the drop-down menu and drill-down and investigate by clicking a broker to view details in the Single Broker Summary display.


|
Time Range |
Select a time range from the drop down menu varying from 2 Minutes to Last 7 Days, or display All Data. |
|||
|
Fields and Data: |
||||
|
|
Broker |
The name of the broker. |
||
|
|
QM Status: |
The status of the Queue Manager on the broker. |
||
|
|
Queues |
The number of queues on the broker. |
||
|
|
Channels |
The number of channels on the broker. |
||
|
|
Total Queue Depth |
The total queue depth. |
||
|
|
Trend Graph |
Traces the queue depth on the broker. |
||