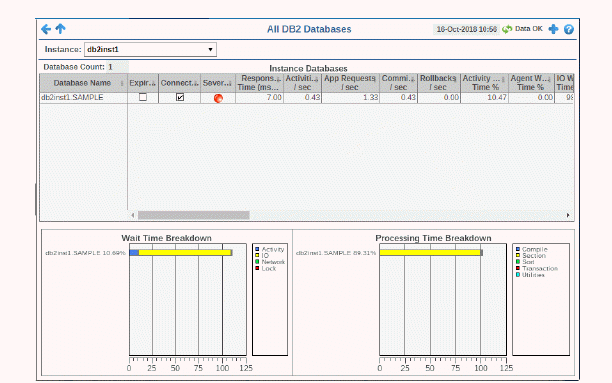
Select an Instance and view a list of all its databases and their performance metrics.
Use this display to identify which databases are having or causing issues for the instance.
Sort the list of databases by Alert Severity or by any other table column value.
In the bar graphs, view Wait Time Breakdown for the instance (by Activity, IO, Network and Lock), as well as Processing Time Breakdown (by Compile, Section, Sort, Transaction and Utilities) for the instance.
Click a row to drill-down to details in the Database Summary display.


|
Instance Databases Table Each row is a different database on the selected instance. Column values describe the database. |
||||
|
Database Count: |
The number of databases in the table. |
|||
|
|
Database |
The name of the database. |
||
|
|
Expired |
When checked, performance data has not been received within the time specified by your administrator for the Expire Time. If your administrator has also set the Delete Time, this row will be deleted if no data is received within the time specified for deletion. |
||
|
|
Connected |
When checked, the database is connected. |
||
|
|
Severity |
The alert status:
|
||
|
|
Response Time |
The response time, in milliseconds. |
||
|
|
I/O Wait Time % |
The percentage wait time taken by I/O operations. |
||
|
|
Network Wait Time % |
The percentage wait time taken by the network. |
||
|
|
Agent Wait Time % |
The percentage wait time taken by agents. |
||
|
|
Avg Deadlocks per Activity |
The average number of application deadlocks per activity. |
||
|
|
Avg Lock Escalations per Activity |
The average number of application deadlock escalations per activity. |
||
|
|
Avg Lock Timeouts per Activity |
The average number of application deadlock timeouts per activity. |
||
|
|
Avg Lock Waits per Activity |
The average number of application deadlock waits per activity. |
||
|
|
Rows Read per Rows Returned |
The number of rows read per number of rows returned. |
||
|
|
Activites/sec |
The number of activities per second. |
||
|
|
App Requests/sec |
The number of application requests per second. |
||
|
|
Commits/sec |
The number of application commits per second. |
||
|
|
Rollbacks/sec |
The number of application rollbacks per second. |
||
|
|
Buffer Pool Hit Ratio % |
The current buffer pool hit ratio, which is the total number of pool hits divided by the total number of buffer pool lookups. |
||
|
|
Activity Wait Time % |
The percentage wait time taken by activities. |
||
|
|
Avg Request CPU Time |
The average amount of CPU time used by requests, in seconds. |
||
|
|
Compile Proc Time % |
The percentage of time used for compiling processes. |
||
|
|
Routine Time Request % |
The percentage of time used for routine request processes. |
||
|
|
Section Time % |
The percentage of time used for section processes. |
||
|
|
Section Sort Time % |
The percentage of time used for sorting section processes. |
||
|
|
BP Hit Ratio % |
The current buffer pool hit ratio, which is the total number of pool hits divided by the total number of buffer pool lookups. |
||
|
|
Transaction Time % |
The percentage of time used for transaction processes. |
||
|
|
Utils Proc Time % |
The percentage of time used for utilities processes. |
||
|
|
Activity Time (ms) |
The amount of time, in milliseconds, used for activity processes. |
||
|
|
Agent Idle Time (ms) |
The amount of time, in milliseconds, that agents were in an idle state. |
||
|
|
CPU Time (ms) |
The amount of time, in milliseconds, used for CPU processes. |
||
|
|
Processing Time (ms) |
The amount of time, in milliseconds, used for processing requests. |
||
|
|
Request Time (ms) |
The amount of time, in milliseconds, used for processing requests. |
||
|
|
DB Processing % |
The percentage of time used for database processes. |
||
|
|
DB Wait % |
The percentage of time used for database waits. |
||
|
|
# Connections |
The current number of database connections. |
||
|
|
Timestamp |
The data and time this data was last updated. |
||
|
Wait Time Breakdown |
Shows the percentage of total wait time used for the instance categorized by:
|
|||
|
Processing Time Breakdown |
Shows the percentage of total processing time for the instance used by the following types of actions:
|
|||