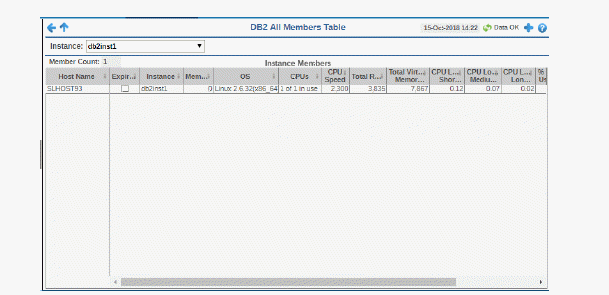
Select an instance Instance to see a list of all host members of an instance.
Each row is a different host that shows configuration details and utilization metrics for each. Details include OS, RAM, CPU load (short, medium, long) and virtual memory.
Click a column header to sort column data in numerical or alphabetical order. Drill-down and investigate by clicking a row to view details for a host member in the Member Summary display.


|
Instance Members Table Each row is a different host member. Column values describe the host. |
||||
|
Member Count: |
The number of members in the table. |
|||
|
|
Host Name |
The name of the host. |
||
|
|
Expired |
When checked, performance data has not been received within the time specified by your administrator for the Expire Time. If your administrator has also set the Delete Time, this row will be deleted if no data is received within the time specified for deletion. |
||
|
|
Instance |
The name of the instance that the host is a member of. |
||
|
|
Member |
The name of the member. |
||
|
|
OS |
The installed operating system. |
||
|
|
CPUs |
The number of CPUs and the number of CPUs in use. |
||
|
|
CPU Speed |
The processor speed. |
||
|
|
Total RAM |
The total amount of RAM, in megabytes. |
||
|
|
Total Virtual Memory |
The total amount of virtual memory, in megabytes. |
||
|
|
CPU Load Short |
Amount of processor load over the short term (defined by the IBM DB2 system, for example, 1-5 minutes). |
||
|
|
CPU Load Medium |
Amount of processor load over the medium term (defined by the IBM DB2 system, for example, 5-10 minutes). |
||
|
|
CPU Load Long |
Percentage of CPU load over the long term (defined by the IBM DB2 system, for example, 10-15 minutes). |
||
|
|
% CPU Usage |
The percentage of CPU used. |
||
|
|
Timestamp |
The data and time this data was last updated. |
||