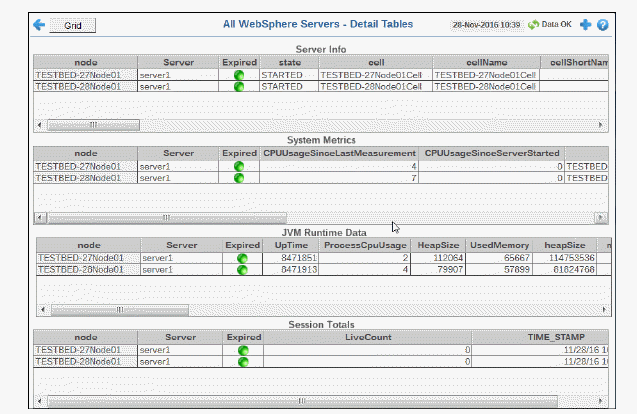
View detailed data for all your WebSphere servers in a tabular format, including system metrics, JVM runtime data and session totals.
Drill-down and investigate by clicking a row in the table to view details for a server in the Server Summary display.
|
Server Info Table Each table row is a different server. Table column values describe the server. |
||
|
|
Node |
The name of the node. |
|
|
Server |
The name of the server. |
|
|
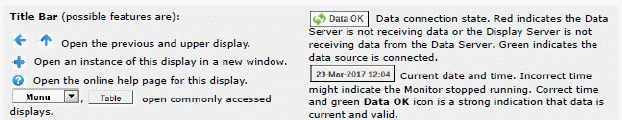
Expired |
|
|
|
State |
The WebSphere server current state:
|
|
|
cell |
The name of the cell. |
|
|
cellName |
The full name of the cell. |
|
|
cellShortName |
The short name for the cell. |
|
|
deployedObjects |
A list of deployed objects on the server. |
|
|
eventTypes |
A list of events that occurred on the server. |
|
|
internalClassAccessMode |
Describes the internal class access mode. Refer to vendor documentation for details. |
|
|
j2eeType |
The J2EE type. |
|
|
javaVMs |
A list of Java virtual machines. |
|
|
mbeanIdentifier |
The MBean id. |
|
|
name |
Refer to vendor documentation for details. |
|
|
nodeName |
The full name of the node. |
|
|
nodeShortName |
The short name for the node. |
|
|
pid |
The WebSphere server process identifier. |
|
|
platform |
The platform type. |
|
|
platformName |
The name of the platform. |
|
|
platformVersion |
The software version on the platform. |
|
|
processType |
The platform type (e.g. UnManagedProcess). |
|
|
resources |
Refer to vendor documentation for details. |
|
|
serverVendor |
The name of the server vendor. |
|
|
shortName |
Refer to vendor documentation for details. |
|
|
spec |
Refer to vendor documentation for details. |
|
|
statisticsProvider |
Refer to vendor documentation for details. |
|
|
threadMonitorAdjustmentThreshold |
Describes thread monitor settings. Refer to vendor documentation for details. |
|
|
threadMonitorInterval |
Describes thread monitor settings. Refer to vendor documentation for details. |
|
|
threadMonitorThreshold |
Describes thread monitor settings. Refer to vendor documentation for details. |
|
|
type |
Refer to vendor documentation for details. |
|
|
version |
Refer to vendor documentation for details. |
|
|
Connection |
The name of the connection. |
|
|
TIME_STAMP |
The date and time of the last data update. |
|
System Metrics Table Each table row is a different server. Table column values describe the server. |
||
|
|
Node |
The name of the node. |
|
|
Server |
The name of the server. |
|
|
Expired |
|
|
|
CPUUsageSinceLastMeasurement |
The amount of CPU usage, in megabytes, since the last data update. |
|
|
CPUUsageSinceServerStarted |
The amount of CPU usage, in megabytes, since the server was started. |
|
|
cell |
The name of the cell. |
|
|
hasStats |
Refer to vendor documentation for details. |
|
|
mbeanIdentier |
The MBean id. |
|
|
name |
Refer to vendor documentation for details. |
|
|
platform |
Refer to vendor documentation for details. |
|
|
spec |
Refer to vendor documentation for details. |
|
|
type |
Refer to vendor documentation for details. |
|
|
Connection |
The name of the connection. |
|
|
TIME_STAMP |
The date and time of the last data update. |
|
JVM Runtime Data Table Each table row is a different server. Table column values describe the server. |
||
|
|
Node |
The name of the node. |
|
|
Server |
The name of the server. |
|
|
Expired |
|
|
|
UpTime |
The amount of time, in milliseconds, since the server was started. |
|
|
ProcessCpuUsage |
The amount of process CPU usage, in megabytes, since the server was started. |
|
|
HeapSize |
The current heap size, in kilobytes. |
|
|
UsedMemory |
The current amount of memory used, in kilobytes. |
|
|
heapSize |
The current heap size, in kilobytes. |
|
|
maxMemory |
The maximum amount of memory used since the server was started. |
|
|
freeMemory |
The current amount of free memory, in kilobytes. |
|
|
usedMemory |
The current amount of used memory, in kilobytes. |
|
|
J2EEServer |
The name of the J2EE server. |
|
|
cell |
The name of the cell. |
|
|
hasStats |
Refer to vendor documentation for details. |
|
|
j2eeType |
The J2EE type. |
|
|
Java Vendor |
The name of the Java vendor. |
|
|
Java Version |
The Java software version. |
|
|
maxHeapDumpsOnDisk |
The maximum amount of heap dumps on disk that have been performed since the last restart. |
|
|
maxSystemDumpsOnDisk |
The maximum amount of system dumps on disk that have been performed since the last restart. |
|
|
mbeanIdentier |
The MBean id. |
|
|
statisticsProvider |
Refer to vendor documentation for details. |
|
|
version |
Refer to vendor documentation for details. |
|
|
Connection |
The name of the connection. |
|
|
spec |
Refer to vendor documentation for details. |
|
|
platform |
Refer to vendor documentation for details. |
|
|
TIME_STAMP |
The date and time of the last data update. |
|
Session Totals Table Each table row is a different server. Table column values describe the server. |
||
|
|
Node |
The name of the node. |
|
|
Server |
The name of the server. |
|
|
Expired |
|
|
|
LiveCount |
The total number of currently active sessions. |
|
|
TIME_STAMP |
The date and time of the last data update. |


