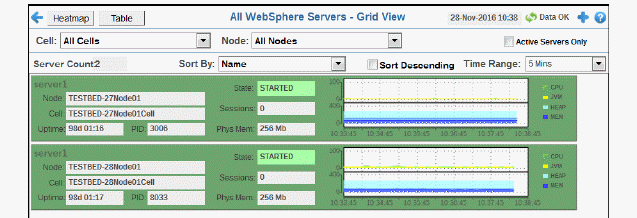
View WebSphere server utilization details, including memory, CPU and heap size, in a grid format. Choose a cell and node from the drop-down menus.
Drill-down and investigate by clicking a row in the table to view details for the selected connection in the Server Summary display.


|
Filter By: |
||
|
|
Cell: |
Choose a cell or All Cells to see metrics for. |
|
|
Node: |
Choose a node or All Nodes to see metrics for. |
|
Fields and Data This display includes: |
||
|
|
Active Servers Only |
Select to only include active servers in the display. |
|
|
Server Count |
The number of servers in the display. |
|
|
Sort By: |
Options are to sort servers in the grid by Name, Live Sessions, JVM CPU %, Up Time or Max Memory. |
|
|
Sort Descending |
Select to organize display elements in descending order. |
|
|
Time Range |
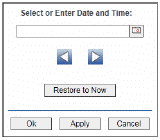
Select a time range from the drop down menu varying from 2 Minutes to Last 7 Days, or display All Data. To specify a time range, click Calendar 
By default, the time range end point is the current time. To change the time range end point, click Calendar Use the navigation arrows Click Restore to Now to reset the time range end point to the current time.
|
|
|
Node |
The name of the node. |
|
|
Cell |
The name of the cell. |
|
|
UpTime |
The amount of time, in milliseconds, since the server was started. |
|
|
PID |
The WebSphere server process identifier. |
|
|
State |
The WebSphere server current state:
|
|
|
Sessions |
The current number of sessions. |
|
|
Phys Mem |
The current amount of disk space, in megabytes. |
|
|
Trend Chart |
|