 to include or exclude labels in the heatmap, and mouse over a rectangle to see additional metrics for a server. Click a rectangle to drill down to the Server Summary display, which shows additional details about the server.
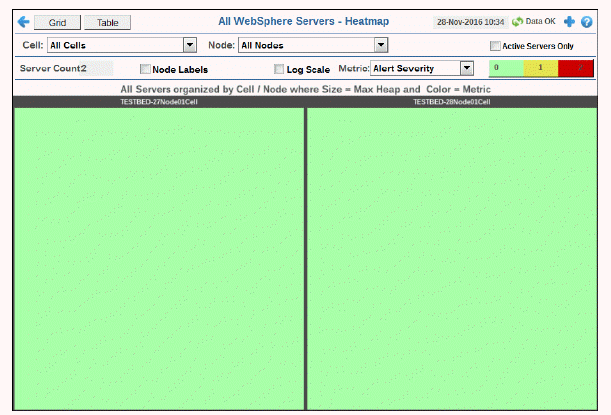
This heatmap shows the current status and utilization metrics for all WebSphere servers. Choose a cell and node from the drop-down menus. Use this display to see metrics for Alert Count, Live Session Count, WAS CPU %, Host CPU % and Memory Used %. By default, this display shows the heatmap based on the Alert Severity metric.
Each rectangle is a different WebSphere server. Use the Node Labels check-box  to include or exclude labels in the heatmap, and mouse over a rectangle to see additional metrics for a server. Click a rectangle to drill down to the Server Summary display, which shows additional details about the server.


|
Filter By: |
|
|
|
|
|
|
Cell: |
Choose a cell or All Cells to see metrics for. |
||
|
|
Node: |
Choose a node or All Nodes to see metrics for. |
||
|
Fields and Data: |
||||
|
|
Active Servers Only |
Choose this check box to only include active servers in the display. |
||
|
|
Server Count |
The number of servers in the display. |
||
|
|
Node Labels |
Select to include node labels in the display. |
||
|
|
Log Scale |
Select to enable a logarithmic scale. Use Log Scale to see usage correlations for data with a wide range of values. For example, if a minority of your data is on a scale of tens, and a majority of your data is on a scale of thousands, the minority of your data is typically not visible in non-log scale graphs. Log Scale makes data on both scales visible by applying logarithmic values rather than actual values to the data. |
||
|
|
Metric |
Choose a metric to view in the display. |
||
|
|
|
Alert Severity |
The current alert severity. Values range from 0 - 2, as indicated in the color gradient
|
|
|
|
|
Alert Count |
The total number of critical and warning unacknowledged alerts. The color gradient |
|
|
|
|
CPU Used% |
The percent CPU used. The color gradient When Auto is checked, the numeric values in the color gradient bar show the range of the data being displayed rather than the default values. The middle value changes accordingly to indicate the color of the middle value of the range. |
|
|
|
|
V Memory Used% |
The percent virtual memory used. The color gradient When Auto is checked, the numeric values in the color gradient bar show the range of the data being displayed rather than the default values. The middle value changes accordingly to indicate the color of the middle value of the range. |
|
|
|
|
Free Memory |
The total amount of available memory. The color gradient The Auto flag does not have any impact on this metric. |
|