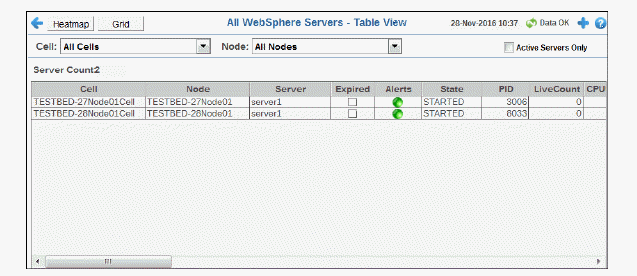
View WebSphere server utilization details, including memory, CPU and heap size. Choose a cell and node from the drop-down menus. Each row in the table is a different server. The row color for inactive servers is dark red.
Drill-down and investigate by clicking a row in the table to view details for the selected connection in the Server Summary display.


|
Filter By: |
|
|
|
|
Cell: |
Choose a cell or All Cells to see metrics for. |
|
|
Node: |
Choose a node or All Nodes to see metrics for. |
|
Fields and Data This display includes: |
||
|
|
Active Servers Only |
Select to only include active servers in the display. |
|
|
Server Count |
The number of servers in the display. |
|
Table Each table row is a different server. Table column values describe the cell on the server. |
||
|
|
Cell |
The name of the cell. |
|
|
Node |
The name of the node. |
|
|
Server |
The name of the server. |
|
|
Expired |
When checked, data has not been received from this host in the specified amount of time. The host will be removed from the Monitor in the specified amount of time. The default setting is 60 seconds. |
|
|
Alert Level |
The current alert severity.
|
|
|
State |
The WebSphere server current state:
|
|
|
PID |
The WebSphere server process identifier. |
|
|
LiveCount |
The total number of currently active sessions. |
|
|
CPUUsageSinceLastMeasurement |
The amount of CPU usage, in megabytes, since the last data update. |
|
|
CPUUsageSinceServerStarted |
The amount of CPU usage, in megabytes, since the server was started. |
|
|
ProcessCpuUsage |
The amount of process CPU usage, in megabytes, since the server was started. |
|
|
UpTime |
The amount of time, in milliseconds, since the server was started. |
|
|
maxMemory |
The maximum amount of memory used since the server was started. |
|
|
heapSize |
The heap size, in kilobytes. |
|
|
usedMemory |
The amount of used memory, in kilobytes. |
|
|
freeMemory |
The amount of free memory, in kilobytes. |
|
|
usedMemoryPercent |
The amount of used memory, in percent. |
|
|
HeapSize |
The heap size, in megabytes. |
|
|
UsedMemory |
The amount of used memory, in megabytes. |
|
|
FreeMemory |
The amount of free memory, in megabytes. |
|
|
maxHeapDumpsOnDisk |
The maximum amount of heap dumps on disk that have been performed since the last restart. |
|
|
maxSystemDumpsOnDisk |
The maximum amount of system dumps on disk that have been performed since the last restart. |
|
|
javaVendor |
The name of the Java software vendor. |
|
|
javaVersion |
The Java software version. |
|
|
TIME_STAMP |
The date and time of the last data update. |