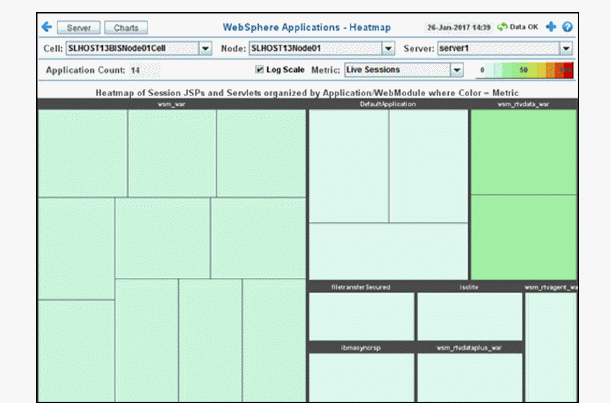
This heatmap shows activity metrics for all web application sessions on a selected server. Use this display to see metrics for Live Sessions, Current Requests, Total Requests and Response Time for all web application sessions on a server. By default, this display shows the heatmap based on the Live Sessions metric.
Each rectangle is a different web application on the server. Choose a Cell, Node and Server from the drop-down menus. Mouse over a rectangle to see additional metrics. Click a rectangle to drill down to the Application Summary display, which shows additional details about the application.


|
Filter By: |
||||
|
|
Cell: |
Choose the cell for which you want to show data. |
||
|
|
Node: |
Choose the node for which you want to show data. |
||
|
|
Server: |
Choose the server for which you want to show data. |
||
|
Fields and Data: |
|
|
||
|
|
Application Count |
The number of web applications in the display. |
||
|
|
Log Scale |
Select to enable a logarithmic scale. Use Log Scale to see usage correlations for data with a wide range of values. For example, if a minority of your data is on a scale of tens, and a majority of your data is on a scale of thousands, the minority of your data is typically not visible in non-log scale graphs. Log Scale makes data on both scales visible by applying logarithmic values rather than actual values to the data. |
||
|
|
Metric |
Choose a metric to view in the display. |
||
|
|
|
Live Sessions |
The current number of live sessions. The color gradient |
|
|
|
|
Current Requests |
The number of current requests. The color gradient |
|
|
|
|
Total Requests |
The total number of requests. The color gradient |
|
|
|
|
Response Time |
The average response time. The color gradient |
|