Several views show historical and current performance metrics for a single engine, including the number of processes running, threads, history of memory utilization, and trend graphs of memory utilization. In this display, when an engine is Stopped the engine name is appended with (X), the background color is light red and Uptime is zero.
Note: Clicking the Processes button in the Title Bar takes you to the All Processes Heatmap . Clicking the JVM button, which is automatically enabled when a JMX connection is defined for the engine, takes you to the JVM CPU/Mem Summary display. See Enable Monitoring Via JMX for more information on enabling a JMX connection.
|
Filter By: The display might include these filtering options: |
||||
|
|
Filter: |
Choose a filter to show data for in the display. By default, the Filter: drop-down menu only contains the No Filter option. To create your own filtering options, see Creating Customized Filters in the User’s Guide. |
||
|
|
Server: |
Choose a server to show data for in the display. |
||
|
|
Engine: |
Choose an engine to show data for in the display. An engine is not running when the engine name is appended with (X). |
||
|
Fields and Data |
||||
|
|
Engine Information |
|||
|
|
|
Status |
ACTIVE |
The BW microagent is providing live data and the engine is assumed active. |
|
|
|
|
SUSPENDED |
This state is reported by the BW microagent. |
|
|
|
|
STANDBY |
This state is reported by the BW microagent. |
|
|
|
|
STOPPING |
This state is reported by the BW microagent. |
|
|
|
|
STOPPED |
This state is reported by the BW microagent. |
|
|
|
|
LIMITED |
Live data has been received from TIBCO, but deployment data from the custom RTView MicroAgent has not been received. |
|
|
|
|
EXPIRED |
The associated server for the engine is currently in an EXPIRED state and is unavailable or stopped sending data. |
|
|
|
Uptime |
Days hours and minutes since the engine was started. |
|
|
|
|
CPU% |
Percent of server CPU used by engine. |
|
|
|
|
Memory% |
Available physical memory remaining (in MB). |
|
|
|
|
Threads |
Number of threads used by this engine |
|
|
|
|
Max Heap MB |
Maximum heap allocated to this engine for the JVM. |
|
|
|
Error Counts |
|||
|
|
|
Total |
Total errors accumulated by this engine. |
|
|
|
|
Current |
Number of errors accumulated this update cycle. |
|
|
|
Process Counts |
|||
|
|
|
Total |
A BW Engine runs processes by creating instances of process definitions and making them active. A given process instance has a lifetime during which it may be suspended, swapped, queued, etc. until it is either completed or aborted. The Total value is calculated using the Hawk method named GetProcessDefinitions that returns statistics about the instances of each process definition including cumulative counts of completed, aborted, suspended, etc. |
|
|
|
|
Running |
Total number of running process instances. This number is calculated using the Hawk method named GetProcessCount. It is displayed in the Monitor Engines Table as RunningProcesses. The trend below displays the same value over time as Running Procs. |
|
|
|
Alerts Indicates the greatest severity level and the number of open Engine, Process, and Activity alerts for the selected engine. Values range from 0 to 2, where 2 is the greatest Severity:
Click on the alert indicator to display the BW Engine - Tables display, which contains a table listing the current alerts for the selected engine. 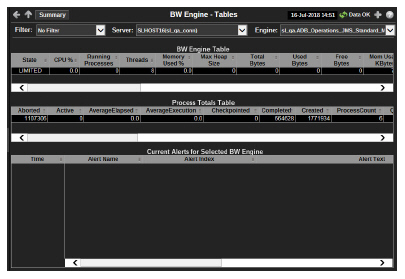
|
|||
|
|
|
Engine |
Number of engine alerts and the most critical alert state for the engine:
|
|
|
|
|
Process |
Number of process alerts and the most critical alert state for the engine:
|
|
|
|
|
Activity |
Number of activity alerts and the most critical alert state for the engine:
|
|
|
|
Heatmap Shows processes organized by Server/Engine where Size = Creation Count and Color = Average Execution. Click on a node to drill down to a specific engine. |
|||
|
|
Trend Graphs |
|||
|
|
|
Log Scale |
Select to enable a logarithmic scale. Use Log Scale to see usage correlations for data with a wide range of values. For example, if a minority of your data is on a scale of tens, and a majority of your data is on a scale of thousands, the minority of your data is typically not visible in non-log scale graphs. Log Scale makes data on both scales visible by applying logarithmic values rather than actual values to the data. |
|
|
|
|
Base at Zero |
Select to use zero (0) as the Y axis minimum for all graph traces. |
|
|
|
|
Time Range |
Select a time range from the drop down menu varying from 2 Minutes to Last 7 Days, or display All Data. To specify a time range, click Calendar 
By default, the time range end point is the current time. To change the time range end point, click Calendar Use the navigation arrows Click Restore to Now to reset the time range end point to the current time.
|
|


 .
.  and select a date and time from the calendar or enter the date and time in the text field using the following format:
  to move forward or backward one time period. NOTE: The time period is determined by your selection from the