 to open the edit pane. For details, see Creating MX Views.
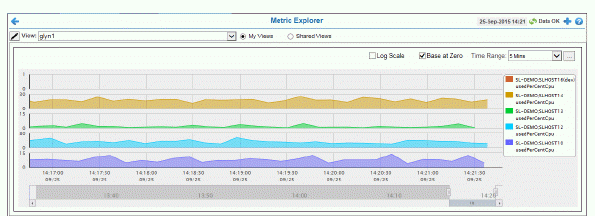
View your previously created MX Views. Select an MX View from the View drop-down menu. The contents of the View drop-down menu depend on whether you choose My Views or Shared Views. Choose My Views to see public and private MX Views owned by you. Choose Shared Views to see public MX Views owned by you and other users. A public MX View is an MX View where the creator chose the Share View with Others option. The creator of the MX View is the owner.
Each MX View has options to apply Log Scale, Base at Zero and Time Range to your graphs.
To create or edit an MX View click Edit to open the edit pane. For details, see Creating MX Views.
|
Fields and Data Options include: |
|||
|
|
|
Open the edit pane. |
|
|
|
View |
Select an MX View from the View drop-down menu. |
|
|
|
My Views |
Choose My Views to see public and private MX Views owned by you in the View drop-down menu. |
|
|
|
Shared View |
Choose Shared Views to see public MX Views owned by you and other users. A public MX View is an MX View where the creator chose the Share View with Others option. The creator of the MX View is the owner. |
|
|
|
Log Scale |
Select to enable a logarithmic scale. Use Log Scale to see usage correlations for data with a wide range of values. For example, if a minority of your data is on a scale of tens, and a majority of your data is on a scale of thousands, the minority of your data is typically not visible in non-log scale graphs. Log Scale makes data on both scales visible by applying logarithmic values rather than actual values to the data. |
|
|
|
Base at Zero |
Use zero as the Y axis minimum for all graph traces. |
|
|
|
Time Range |
Select a time range from the drop down menu varying from 2 Minutes to Last 7 Days, or display All Data. To specify a time range, click Calendar 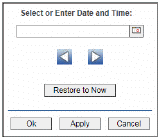
By default, the time range end point is the current time. To change the time range end point, click Calendar Use the navigation arrows Click Restore to Now to reset the time range end point to the current time.
|
|
Click Edit  to open the edit pane. If an MX View is already selected, click New
  to start a new MX View.

Select the Service containing the metric you want to see from the Metrics Options/Service Tree. The Service Tree is filtered by the environment in the Env menu. If necessary select the environment containing your Service. When you select a Service, all available metrics for that Service are listed in the Metric Tree. Because the metric will be displayed in a trend graph, only numeric metrics with history are listed in the Metric Tree. Select the metric you want to see from the Metrics Options/Metric Tree and click Add Metric. The metric is added to the Selected Metrics list and the MX View preview (in the right panel). Add up to five metrics to your MX View.
To change the order in which the metrics are displayed in the graph use the Up  and Down
  arrows. To remove a metric, select it in the Selected Metrics and click Trash
  . To add a label to your metric, select it in the Selected Metrics list and enter your label text in the Label field. Click Apply
  to apply the label, or Cancel
  to cancel the label.
Click Save and enter a descriptive MX View name. Click Share View with Others to make your MX View public, otherwise, the MX View is only available to you. Click Confirm  to write the MX View to the database. Click Cancel
  to return to edit mode. Click Done to return to the Metric Explorer page. The MX View you created is added to the View drop-down menu.
To create a new MX View with the Service already selected, select a Service from a Service Summary Views display and click MX  (or the table context menu). This opens the MX edit pane with the Service already selected in the MX edit pane Service Tree. If you selected a CI Type or CI, these are also already selected in the MX edit pane Metric Tree. This spares you from having to search for the Service, CI Type or CI in the Service and Metrics Trees. The displays from which you can use this feature are:
Service Summary Views - Service By CI Type
Service Summary Views - Service Summary
In the Metric Explorer, select the MX View you want to edit and click Edit  . The edit pane opens with the selected MX View in edit mode. To delete the MX View click Trash
  . To save your MX View under a new name, click Save As. Add, remove, reorder or label metrics as described in the Creating MX Views section (above). Select a metric in the Selected Metrics list and click on Search to update the selection in the Service Tree and Metric Tree to the values used when that metric was added to the MX View. This is useful when you want to see which Service contains a metric so you can add more metrics from the same Service.
When you are finished editing your metric, you can click Cancel to cancel your changes or Save to save your changes. To edit another MX View, select it from the View drop-down menu. Click Done to return to the Metric Explorer page.
Note: When you edit an MX View you do not own a copy of the MX View is automatically created and you are prompted to enter a name for the MX View when you save it.
|
View Options |
|
|
|
Create a new MX View. |
|
|
Delete the selected MX View. |
|
Save |
Save the selected MX View. If this is an existing MX View, the save is done immediately. If this is a new MX View, the Name field becomes available and you must enter a name and click Confirm Save to save your MX View. |
|
Save As |
Save the selected MX View under a new name. The Name field becomes available and you must enter a name and click Confirm Save to save your MX View. |
|
Done |
Close the edit pane. This option is available when you do not have unsaved changes. |
|
Cancel |
Cancel your edits. |
|
Name |
Enter a name for your MX View. This field is available when saving a new MX View or after you click Save As. |
|
|
Confirm that you want to save your MX View after you enter a name. This option is available when saving a new MX View or after you click Save As. |
|
|
Cancel the save. This is available when saving a new MX View or after you click Save As. |
|
Share View |
Select to make your MX View public. Public MX Views are available to all users in the View drop-down menu when the Shared Views option is selected. Deselect to make this MX View only available to you. |
|
Metric Options |
|
|
Env |
Select an Environment to filter the items in the Service Tree. |
|
Service Tree |
The CMDB service model (Owner, Area, Group, Service). Select a Service to populate the Metric Tree with metrics for that Service. The Services in the Service Tree are filtered by the following login substitutions: $rtvOwnerMask, $rtvAreaMask, $rtvGroupMask and $rtvServiceMask. For details, refer to the RTView Enterprise Configuration Guide. |
|
Metric Tree |
The available metrics for the selected service. The tree hierarchy is CI Type, CI name, Metric (cache: metric). The tree only contains numeric metrics with history. |
|
Add Metric |
Add the selected metric to the MX View. When a metric is added to the MX View, it appears in the graph. |
|
Selected Metrics |
The list of metrics for this MX View. |
|
|
Move the metric up in the list of selected metrics. |
|
|
Move the metric down in the list of selected metrics. |
|
|
Set the selection in the Service and Metric trees to the values used when you added the selected metric to the MX View. Note: If your CMDB has changed such that the Service you used to add this metric no longer exists, the search button will fail |
|
|
Delete the selected metric from the MX View. |
|
Label |
Enter a label to use for the selected metric. This label is not applied until you click on the confirm label button. This label is used in the graph legend. |
|
|
Confirm the label you entered for the selected metric. |
|
|
Discard the label you entered for the selected metric (revert back to the previously applied value). |
The Search  button fails without an error if the Service that was selected when you initially added the metric is no longer in your CMDB. To fix this, delete the metric and add it again from a Service that is currently in your CMDB. Note: The missing Service only makes the Search button fail. It does not cause any problems with viewing the metric.
When you try to add a metric to an MX View that already contains that metric, it will not be added again. In the Viewer, an error message will come up saying that the metric is already in the MX View. In the Thin Client, no error is shown.
MX Views are limited to five metrics. After a view contains five metrics, the Add Metric button is disabled.
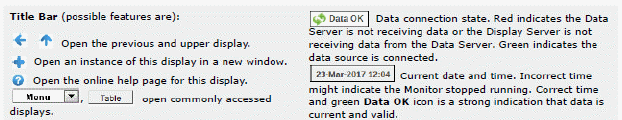
There is no indicator that shows if the MX database or Central Configuration Server are off-line in the MX configuration display. Any changes you save when either the MX database or Central Configuration Server are off line will be lost.
When you save an MX View, RTView writes to both the View Table and the Metrics Table to the database even if only one or the other changed.
When you save an MX View, the MX Configuration UI temporarily reverts back to the previous version of the MX View for one update, then updates with the latest changes.
By default, MX attaches to the history_combo table for the metric history. If the cache is not configured with a history_combo table, the Metric Explorer will instead make a one-time attachment to the history table. In this case, toggling the Log Scale check-box will cause all points plotted after the initial history query to be lost. On the next update of current data a straight line will be drawn from the last history point to the new current data point.

 .
.  and select a date and time from the calendar or enter the date and time in the text field using the following format:
  to move forward or backward one time period. NOTE: The time period is determined by your selection from the


