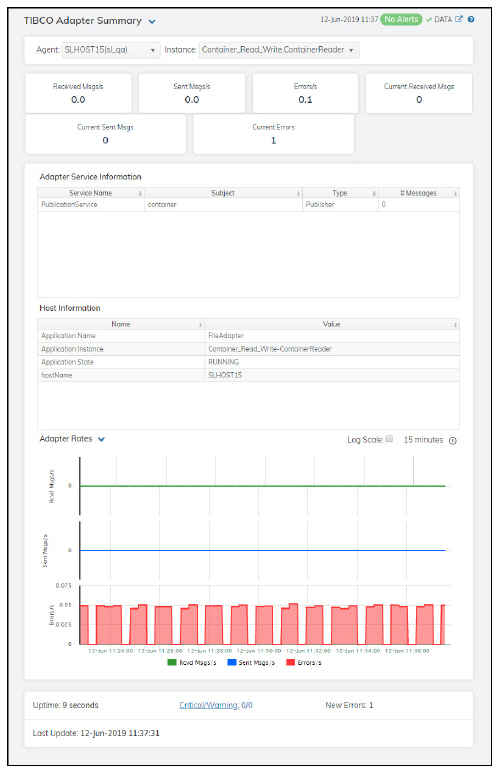
Clicking Single Adapter in the left/navigation menu opens the TIBCO Adapter Summary display, which allows you to view current as well as trending data for a single adapter. Clicking on the information boxes at the top of the display takes you to the TIBCO Adapters Table display, where you can view additional adapter data. You can view message statistics, adapter service information, and host information for a specific instance.
The trend graph has two options: Adapter Rates and Adapter Current Counts. Adapter Rates traces the current and historical rate of messages received, rate of messages sent, and rate of errors over a selected time range. Adapter Current Counts traces current and historical messages received, messages sent, and number of errors over a selected time range.
Clicking the Critical/Warning link at the bottom of the display opens the Alerts Table by Component display.
Note: Fields/columns with an asterisk (*) at the end of the field/column definition contain data that is provided by the selected adapter. Refer to TIBCO Adapter documentation for more information regarding these fields.
|
Filter By: |
||||
|
|
Agent |
Select the agent for which you want to show data in the display. |
||
|
|
Instance |
Select the instance for which you want to show data in the display. |
||
|
Fields and Data: |
||||
|
|
Received Msgs/s |
The number of messages received per second on the adapter.* |
||
|
|
Sent Msgs/s |
The number of messages sent per second from the adapter.* |
||
|
|
Errors/s |
The number of errors occurring per second on the adapter.* |
||
|
|
Current Received Msgs |
The increase in the number of messages received since the last polling update.* |
||
|
|
Current Sent Msgs |
Deltas -- The increase in the number of messages sent since the last polling update.* |
||
|
|
Current Errors |
The increase in the number of errors since the last polling update.* |
||
|
Adapter Service Information Table |
||||
|
|
Service Name |
The name of the service.* |
|
|
|
|
Subject |
The name of the subject.* |
|
|
|
|
Type |
The type of adapter service.* |
||
|
|
# Messages |
The current number of messages.* |
||
|
Host Information Table |
||||
|
|
Name |
The name of the host.* |
||
|
|
Value |
The host’s value.* |
||
|
Trend Graphs |
Adapter Rates Rcvd Msgs/s -- traces rate of messages received. Sent msgs/s-- traces the rate of messages sent. Errors/s -- traces the rate of errors. Adapter Current Counts Rcvd Msgs -- traces the increase in the number of messages received since the last polling update. Sent Msgs -- traces the increase in the number of messages sent since the last polling update. Errors -- traces the increase in the number of errors since the last polling update. |
|||
|
|
|
Log Scale |
Select to enable a logarithmic scale. Use Log Scale to see usage correlations for data with a wide range of values. For example, if a minority of your data is on a scale of tens, and a majority of your data is on a scale of thousands, the minority of your data is typically not visible in non-log scale graphs. Log Scale makes data on both scales visible by applying logarithmic values rather than actual values to the data. |
|
|
|
|
Time Settings |
Select a time range from the drop down menu varying from 5 Minutes to Last 7 Days. By default, the time range end point is the current time. 
To change the time range, deselect the now toggle, which displays some additional date fields. You can click the left and right arrow buttons to decrease the end time by one time period (the time selected in the Time range drop down) per click, or you can choose the date and time from the associated calendar and clock icons. You can also enter the date and time in the text field using the following format: MMM dd, YYYY HH:MM:ss. For example, Aug 21, 2018 12:24 PM. Click the now toggle to reset the time range end point to the current time.
|
|
|
Uptime |
The amount of time the adapter has been up and running. |
|||
|
Critical/Warning |
The number of critical and warning errors. |
|||
|
New Errors |
The number of erorrs since the last data update. |
|||
|
Last Update |
The date and time in which the data in the display was last updated. |
|||