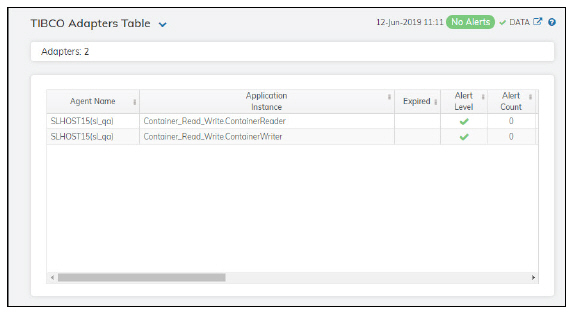
The table in this display provides a view of all of your adapters and their associated metric data including agent, application instance, alert severity, alert count, and the current value of each gathered metric. You can click a column header to sort column data in numerical or alphabetical order, and drill-down and investigate by double-clicking a row to view details for the selected adapter in the TIBCO Adapter Summary display
Note: Fields/columns with an asterisk (*) at the end of the field/column definition contain data that is provided by the selected adapter. Refer to TIBCO Adapter documentation for more information regarding these fields.
|
Fields and Data: |
||||
|
|
Adapters |
The total number of adapters listed in the table. |
||
|
All Adapters Table: |
||||
|
|
Agent Name |
The name of the agent. |
||
|
|
Application Instance |
The name of the application instance. |
||
|
|
Alert Level |
The current alert severity.
|
||
|
|
Alert Count |
The total number of alerts for the host. |
||
|
|
Adapter Name |
The name of the adapter.* |
||
|
|
Received Msgs |
The number messages received.* |
||
|
|
Sent Msgs |
The total number of messages sent.* |
||
|
|
Total Errors |
The total number of errors.* |
||
|
|
Total Errors/s |
The number of errors per second.* |
||
|
|
Sent Msgs/s |
The number of messages sent per second.* |
||
|
|
New Errors |
The number of new errors received since the last polling update.* |
||
|
|
Process ID |
The process ID of TIBCO Adapter you are running.* |
||
|
|
Current Sent Msgs |
The increase in the number of messages sent (from the previous polling period to the current polling period).* |
||
|
|
Last Restart |
The date and time the adapter was last restarted.* |
||
|
|
Current Received Msgs |
The increase in the number of messages received (from the previous polling period to the current polling period).* |
||
|
|
Current Total Errors |
The increase in the number total errors (from the previous polling period to the current polling period).* |
||
|
|
Received Msgs/s |
The number of messages received per second.* |
||
|
|
Expired |
When checked, performance data has not been received within the time specified (in seconds) in the Expire Time field in the Duration region in the RTView Configuration Application > (Project Name) > Solution Package Configuration > TIBCO Adapters > DATA STORAGE tab. The Delete Time field (also in the Duration region) allows you to define the amount of time (in seconds) in which the row will be removed from the table if there is no response. |
||
|
|
Timestamp |
The date and time the row data was last updated. |
||


