MS SQL Server View
These displays provide detailed data for a particular server. Clicking MS SQL Server from the left/navigation menu opens the MS SQL Server Summary display, which displays performance, processing, alerts, memory, and trend data for a particular database server. The options available under MS SQL Server are:
| • | Instance Details: Opens the MS SQL Server Performance display, which displays various database details as well as trending data for the page life expectancy. |
| • | Wait Stats: Opens the MS SQL Server Waits Table display, which displays server wait time details in a table format for a particular database server. |
| • | Table Sizes: Opens the MS SQL Server DB Table Sizes display, which displays database and table sizes for a particular database server. |
MS SQL Server Summary
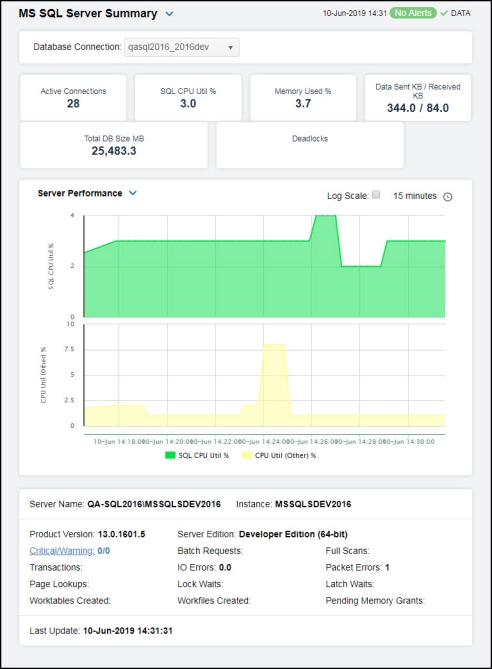
Clicking MS SQL Server in the left/navigation menu opens the MS SQL Server Summary display, which allows you to view current as well as trending data for the server. Clicking on the information boxes at the top of the display takes you to the MS SQL Servers Table display, where you can view additional engines data.
The trend graph at the bottom of the display contains three different options: Server Performance, Server Throughput, and Server Operations. The Server Performance trend graph allows you to view trend data for the SQL CPU utilization percentage and CPU utilization (other types) over a selected time range. The Server Throughput trend graph allows you to view trend data for current data being sent/received and the current input/output reads/writes over a selected time range. The Server Operations trend graph allows you to view trend data for active connections, current batch requests, current latch waits, and current lock waits over a selected time range.
Clicking the Critical/Warning link at the bottom of the display opens the Alerts Table by Component display.
Note: Fields/columns with an asterisk (*) at the end of the field/column definition contain data that is provided by the selected server. Refer to Microsoft SQL Server documentation for more information regarding these fields.
|
Filter By: |
||||
|
|
Database Connection |
Select the database for which you want to show data in the display. |
||
|
Fields and Data: |
||||
|
|
Active Connections |
The number of active connections on the server.* |
||
|
|
SQL CPU Util % |
The percentage of CPU used on SQL processing of the instance.* |
||
|
|
Memory Used % |
The percentage of memory utilization of the database instance. |
||
|
|
Data Sent KB/ Received KB |
The number of kilobytes sent and received.* |
||
|
|
Total DB Size MB |
Total size of the database instance, in megabytes |
||
|
|
Deadlocks |
The number of deadlocks on the database instance. |
||
|
Trend Graphs |
Server Performance SQL CPU Util % -- Traces the percentage of CPU used on SQL processing of the instance. CPU Util (Other) % -- Traces the percentage of CPU used by other processes on the instance. Server Throughput Current Data Sent KB -- Traces the amount of kilobytes being sent. Current Data Received KB -- Traces the amount of kilobytes being received. Current IO Reads -- Traces the number of input/output reads. Current IO Writes -- Traces the number of input/output writes. Server Operations Active Connections -- Traces the number of active connections. Current Batch Requests -- Traces the number of batch requests since the last data update. Current Latch Waits -- Traces the number of latch waits since the last data update. Current Lock Waits -- Traces the number of lock waits since the last data update. |
|||
|
|
|
Log Scale |
Select to enable a logarithmic scale. Use Log Scale to see usage correlations for data with a wide range of values. For example, if a minority of your data is on a scale of tens, and a majority of your data is on a scale of thousands, the minority of your data is typically not visible in non-log scale graphs. Log Scale makes data on both scales visible by applying logarithmic values rather than actual values to the data. |
|
|
|
|
Time Settings |
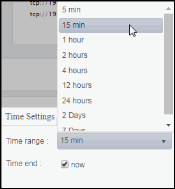
Select a time range from the drop down menu varying from 5 Minutes to Last 7 Days. By default, the time range end point is the current time.
To change the time range, deselect the now toggle, which displays some additional date fields. You can click the left and right arrow buttons to decrease the end time by one time period (the time selected in the Time range drop down) per click, or you can choose the date and time from the associated calendar and clock icons. You can also enter the date and time in the text field using the following format: MMM dd, YYYY HH:MM:ss. For example, Aug 21, 2018 12:24 PM. Click the now toggle to reset the time range end point to the current time.
|
|
|
Server Name |
The name of the server. |
|||
|
Instance |
The name of the instance. |
|||
|
Product Version |
The MS SQL Server’s version number. |
|||
|
Critical / Warning |
The number of critical and warning alerts. |
|||
|
Transactions |
The number of transactions.* |
|||
|
Page Lookups |
The number of page lookups. |
|||
|
Worktables Created |
The number of worktables created. |
|||
|
Server Edition |
The SQL Server’s edition.* |
|||
|
Batch Requests |
The number of batch requests on the server. |
|||
|
IO Errors |
The number of input/output operation errors on the server. |
|||
|
Lock Waits |
The number of lock waits. |
|||
|
Workfiles Created |
The number of workfiles created. |
|||
|
Full Scans |
The number of full scans executed. |
|||
|
Packet Errors |
The number of packet errors. |
|||
|
Latch Waits |
The number of latch waits. |
|||
|
Pending Memory Grants |
The number of pending memory grants. |
|||
|
Last Update. |
The date and time of the last data update.
|
|||
MS SQL Server Performance
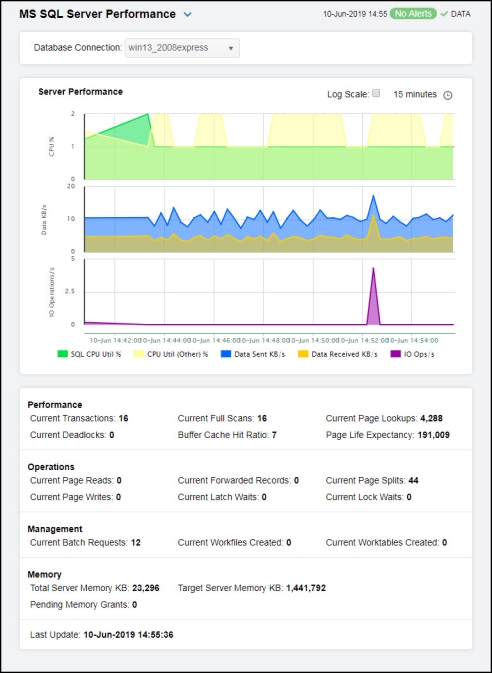
Clicking Instance Details in the left/navigation menu opens the MS SQL Server Performance display, which allows you to view various database details as well as trending data for the page life expectancy.
|
Filter By: The display might include these filtering options: |
||||
|
|
Database Connection |
Select the database for which you want to show data in the display. |
||
|
Performance Trends Graph |
Traces the following: SQL CPU Util % -- Traces percentage of CPU used by the MS SQL Server. CPU Util (Other) % -- Traces the percentage of CPU used in other operations by the MS SQL Server. Data Sent KB/s -- Traces the rate of data sent, in kilobytes per second. Data Received KB/s -- Traces the rate of data received, in kilobytes per second. IO Operations/s -- Traces the rate of input/output operations. |
|||
|
|
|
Log Scale |
Select to enable a logarithmic scale. Use Log Scale to see usage correlations for data with a wide range of values. For example, if a minority of your data is on a scale of tens, and a majority of your data is on a scale of thousands, the minority of your data is typically not visible in non-log scale graphs. Log Scale makes data on both scales visible by applying logarithmic values rather than actual values to the data. |
|
|
|
|
Time Settings |
Select a time range from the drop down menu varying from 5 Minutes to Last 7 Days. By default, the time range end point is the current time.
To change the time range, deselect the now toggle, which displays some additional date fields. You can click the left and right arrow buttons to decrease the end time by one time period (the time selected in the Time range drop down) per click, or you can choose the date and time from the associated calendar and clock icons. You can also enter the date and time in the text field using the following format: MMM dd, YYYY HH:MM:ss. For example, Aug 21, 2018 12:24 PM. Click the now toggle to reset the time range end point to the current time.
|
|
|
Performance |
||||
|
|
Current Transactions |
The number of transactions since the last data update.* |
||
|
|
Current Deadlocks |
The number of deadlocks since the last data update.* |
||
|
|
Current Full Scans |
The number of full scans since the last data update.* |
||
|
|
Buffer Cache Hit Ratio |
The current buffer cache hit ratio, which is the total number of cache hits divided by the total number of cache lookups.* |
||
|
|
Current Page Lookups |
The number of page lookups since the last data update.* |
||
|
|
Page Life Expectancy |
The average number of seconds a page stays in the cache.* |
||
|
Operations |
||||
|
|
Current Page Reads |
The number of page reads since the last data update.* |
||
|
|
Current Page Writes |
The number of page writes since the last data update.* |
||
|
|
Current Forwarded Records |
The number of forwarded records since the last data update.* |
||
|
|
Current Latch Waits |
The number of latch waits since the last data update.* |
||
|
|
Current Page Splits |
The number of page splits since the last data update.* |
||
|
|
Current Lock Waits |
The number of lock waits since the last data update.* |
||
|
Management |
||||
|
|
Current Batch Requests |
The number of batch requests since the last data update.* |
||
|
|
Current Workfiles Created |
The number of work files created since the last data update.* |
||
|
|
Current Worktables Created |
The number of worktables created since the last data update.* |
||
|
Memory |
||||
|
|
Total Server Memory KB |
The total amount of memory the server has committed using the memory manager, in kilobytes.* |
||
|
|
Target Server Memory KB |
The defined target server memory, which is the ideal amount of memory the server can consume, in kilobytes.* |
||
|
|
Pending Memory Grants |
The current number of processes waiting for a workspace memory grant.* |
||
|
Last Update |
The date and time of the last data update. |
|||

MS SQL Server Waits Table
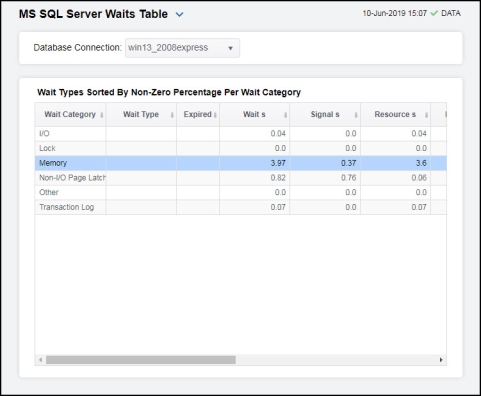
Clicking Wait Stats in the left/navigation menu opens the MS SQL Server Waits Table display, which allows you to view server wait type details in a table format for a particular database server.
Note: Fields/columns with an asterisk (*) at the end of the field/column definition contain data that is provided by the selected server. Refer to Microsoft SQL Server documentation for more information regarding these fields.
|
Filter By: The display includes these filtering options: |
||||
|
|
Database Connection |
Select the database for which you want to show data in the display. |
||
|
Wait Types Sorted By Non-Zero Percentage Per Wait Category Table |
||||
|
|
Wait Category |
The name of the wait category.* |
||
|
|
Wait Type |
The name of the wait type.* |
||
|
|
Wait s |
The average length of the wait time, in seconds.* |
||
|
|
Signal s |
When the thread is marked as runnable, this field displays the wait time, in seconds, that it takes to get into the running state.* |
||
|
|
Resource s |
The length of time the thread spent in a suspended state waiting to acquire a resource, in seconds.* |
||
|
|
Percentage |
The percentage of time the thread spent in a wait state for this wait type.* |
||
|
|
Wait Count |
The number of lock requests that required the caller to wait.* |
||
|
|
Avg Wait s |
The average wait time, in seconds.* |
||
|
|
Avg Signal s |
The average wait signal time, in seconds.* |
||
|
|
Avg Resource Time s |
The average length of time taken to acquire a resource, in seconds.* |
||
|
|
Expired |
When checked, performance data has not been received within the time specified (in seconds) in the Expire Time field in the Duration region in the RTView Configuration Application > (Project Name) > Solution Package Configuration > Microsoft SQL Server > DATA STORAGE tab. The Delete Time field (also in the Duration region) allows you to define the amount of time (in seconds) in which the row will be removed from the table if there is no response. |
||
|
|
Time Stamp |
The date and time the row data was last updated. |
||
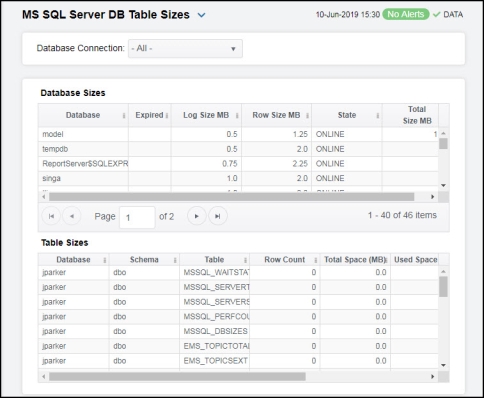
MS SQL Server DB Table Sizes
Clicking Table Sizes in the left/navigation menu opens the MS SQL Server BD Table Sizes display, which provides database and table size data for a particular SQL database server.
Note: Fields/columns with an asterisk (*) at the end of the field/column definition contain data that is provided by the selected server. Refer to Microsoft SQL Server documentation for more information regarding these fields.
|
Filter By: |
||||
|
|
Database Connection |
Select the database for which you want to show data in the display. |
||
|
Database Sizes Table |
||||
|
|
Database |
The name of the database.* |
||
|
|
Log Size MB |
The size of the log, in megabytes.* |
||
|
|
Row Size MB |
The row size, in megabytes.* |
||
|
|
State |
The current state of the database.* |
||
|
|
Total Size MB |
The total size of the database, in megabytes.* |
||
|
|
Expired |
When checked, performance data has not been received within the time specified (in seconds) in the Expire Time field in the Duration region in the RTView Configuration Application > (Project Name) > Solution Package Configuration > Microsoft SQL Server > DATA STORAGE tab. The Delete Time field (also in the Duration region) allows you to define the amount of time (in seconds) in which the row will be removed from the table if there is no response. |
||
|
Table Sizes |
||||
|
|
Database |
The name of the database.* |
||
|
|
Schema |
The name of the schema.* |
||
|
|
Table |
The name of the table.* |
||
|
|
Row Count |
The number of rows in the table.* |
||
|
|
Total Space (MB) |
The total space, in megabytes, available in the table.* |
||
|
|
Used Space (MB) |
The total number of used megabytes in the table.* |
||
|
|
Unused Space (MB) |
The total number of unused megabytes in the table.* |
||
|
|
Creation Date |
The date and time the table was created.* |
||