MS Servers View
These displays provide detailed data for all MS SQL servers. Clicking MS SQL Servers from the left/navigation menu opens the MS SQL Servers Table display, which shows a tabular view of all MS SQL servers and their associated metrics. The option available under MS SQL Servers is:
| • | MS SQL Servers Heatmap: Opens the MS SQL Servers Heatmap display, which provides a heatmap view of all MS SQL servers and their associated metrics. |
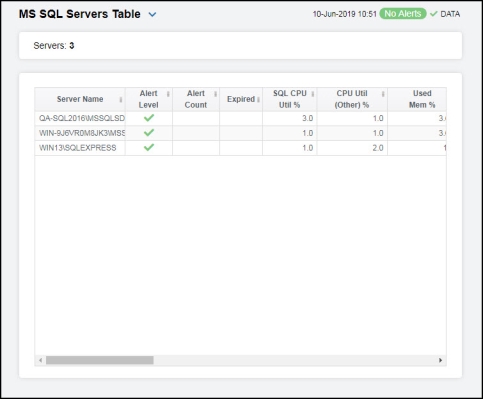
MS SQL Servers Table
This table provides a view of all of your servers and their associated metric data including instance, alert severity, alert count, and the current value of each gathered metric. You can click a column header to sort column data in numerical or alphabetical order, and drill-down and investigate by double-clicking a row to view details for the selected server in the MS SQL Server Summary display.
Note: Fields/columns with an asterisk (*) at the end of the field/column definition contain data that is provided by the server. Refer to Microsoft SQL Server documentation for more information regarding these fields.
|
Fields and Data |
||||
|
Servers |
The number of servers found and listed in the table. |
|||
|
Table |
||||
|
|
Server Name |
The name of the server. |
||
|
|
Alert Level |
The current alert severity.
|
||
|
|
Alert Count |
The total number of alerts for the host. |
||
|
|
SQL CPU Util % |
The CPU utilization percentage related to SQL.* |
||
|
|
CPU Util (Other) % |
The CPU utilization percentage for processes other than SQL.* |
||
|
|
Used Mem % |
The percentage of memory used on the server.* |
||
|
|
Remaining Mem % |
The percentage of memory remaining on the server.* |
||
|
|
Current IO Reads |
The increase in the amount of input/output reads operations (from the previous polling period to the current polling period). |
||
|
|
Current IO Writes |
The increase in the amount of input/output write operations (from the previous polling period to the current polling period). |
||
|
|
Current IO Errors |
The increase in the amount of input/output errors (from the previous polling period to the current polling period). |
||
|
|
Active Connections |
The number of currently active connections. |
||
|
|
IO Busy ms |
The time, in milliseconds, that the system has been busy due to Input/Output operations.* |
||
|
|
Total DB Size MB |
The size of the database, in megabytes.* |
||
|
|
Current Data Sent KB |
The increase in the amount of data being sent (from the previous polling period to the current polling period), in kilobytes. |
||
|
|
Current Data Rcvd KB |
The increase in the amount of data being received (from the previous polling period to the current polling period), in kilobytes. |
||
|
|
Current Packet Errors |
The increase in the amount of packet errors (from the previous polling period to the current polling period). |
||
|
|
Product Level |
The product level of the server.* |
||
|
|
Instance |
The name of the instance. |
||
|
|
Server Edition |
The version of the server.* |
||
|
|
Product Version |
The product’s version number.* |
||
|
|
Expired |
When checked, performance data has not been received within the time specified (in seconds) in the Expire Time field in the Duration region in the RTView Configuration Application > (Project Name) > Solution Package Configuration > Microsoft SQL Server > DATA STORAGE tab. The Delete Time field (also in the Duration region) allows you to define the amount of time (in seconds) in which the row will be removed from the table if there is no response. |
||


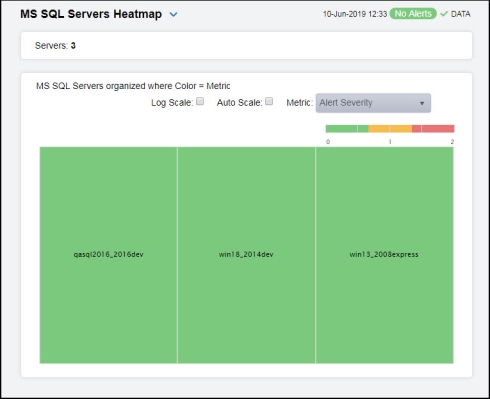
MS SQL Servers Heatmap
Clicking MS SQL Servers Heatmap in the left/navigation menu opens the MS SQL Servers Heatmap, which provides an easy-to-view interface that allows you to quickly identify the current status of each of your servers for each available metric. You can view the servers in the heatmap based on the following metrics: the current alert severity, the current alert count, and the percentage of CPU used. By default, this display shows the heatmap based on the Alert Severity metric.
Each rectangle in the heatmap represents a server. The rectangle color indicates the most critical alert state associated with the server. Choose a different metric to display from the Metric drop-down menu. Mouse over a rectangle to see additional metrics. By default, this display shows Alert Severity.
Drill-down and investigate a server by clicking a rectangle in the heatmap to view details in the MS SQL Server Summary display.
|
Fields and Data: |
||||
|
|
Servers |
The number of servers found and listed in the heatmap. |
||
|
|
Log Scale |
Select this check box to enable a logarithmic scale. Use Log Scale to see usage correlations for data with a wide range of values. For example, if a minority of your data is on a scale of tens, and a majority of your data is on a scale of thousands, the minority of your data is typically not visible in non-log scale graphs. Log Scale makes data on both scales visible by applying logarithmic values rather than actual values to the data. |
||
|
|
Auto Scale |
Select to enable auto-scaling. When auto-scaling is activated, the color gradient bar's maximum range displays the highest value. Note: Some metrics auto-scale automatically, even when Auto Scale is not selected. |
||
|
|
Metric |
Select the metric driving the heatmap display. The default is Alert Severity. Each Metric has a color gradient bar that maps values to colors. The heatmap organizes the servers by host, where each rectangle represents an server. Mouse-over any rectangle to display the current values of the metrics for the server. Click on a rectangle to drill-down to the associated MS SQL Server Summary display for a detailed view of metrics for that particular server. |
||
|
|
|
Alert Severity |
The current alert severity. Values range from 0 - 2, as indicated in the color gradient
|
|
|
|
|
Alert Count |
The total number of critical and warning unacknowledged alerts in the engine. The color gradient |
|
|
|
|
SQL CPU Utilization (%) |
The percentage of CPU used by the instance. The color gradient When Auto Scale is checked, the numeric values in the color gradient bar show the range of the data being displayed rather than the default values. The middle value changes accordingly to indicate the color of the middle value of the range. |
|


