BE Clusters
These displays present performance metrics and alert status for your BusinessEvents system. Clicking BE Clusters from the left/navigation menu opens the TIBCO BE Clusters Table display, which shows all available utilization metrics for all BE clusters. The options available under BE Clusters are:
| • | Clusters Heatmap: Opens the TIBCO BE Clusters Heatmap , which shows cluster and alert status for all BE clusters. |
| • | Clusters Summary: Opens the >TIBCO BE Cluster Summary display, which shows information for a single BE Cluster. |
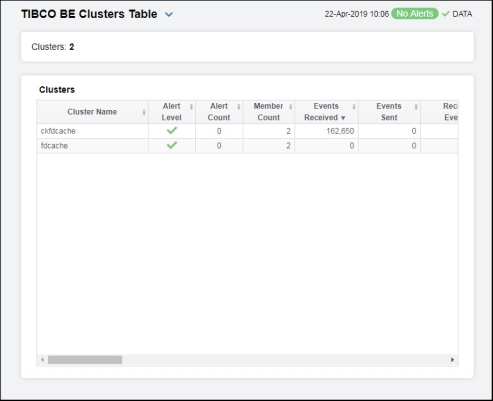
TIBCO BE Clusters Table
Use this display to check event, concept, and backing store metrics for all of your clusters. Consider keeping this display open to monitor your TIBCO BusinessEvents clusters in general. Each row in the table contains data for a particular cluster. Click a column header to sort column data in ascending or descending order. Double-click on a table row to drill-down to the TIBCO BE Cluster Summary display and view metrics for that particular cluster. Toggle between the commonly accessed Table and Heatmap displays by clicking the drop down list on the display title.
|
Clusters Table Each row in the table is a different cluster, and data in the row columns describe the cluster. Note: Row columns in this table with an asterisk (*) at the end of the column definition contain data that is provided by the TIBCO MBean interface. Refer to TIBCO documentation for more information regarding these columns. |
||||
|
|
Clusters: |
The total number of clusters in the table. |
||
|
|
Cluster Name |
The name of the TIBCO BusinessEvents cluster. |
||
|
|
Alert Level |
The severity level of open alerts. Values range from 0 to 2, where 2 is the greatest Severity:
|
||
|
|
Alert Count |
The total number of critical and warning alerts. |
||
|
|
Member Count |
The count of the number of nodes (both cache and inference) that have been collected. For example, for a cluster that has 3 inference nodes and two cache nodes, the Member Count for all 5 rows in the Cluster Table should be 5. If one of the rows shows a member count of one and the others show four, that is a clear indication that a node failed to join the cluster, and the corresponding node should be restarted. Note: The actual number of nodes in the cluster will not match the count in this column if one or more of the nodes do not have connection properties configured in the property file that is read by the data server at startup. |
||
|
|
Events Received |
The total number of events received.* |
||
|
|
Events Sent |
The total number of events sent.* |
||
|
|
Received Events/ S |
The rate of events received in the cluster. |
||
|
|
Asserts/s From Channel |
The rate of events asserted into the Rete network via the channel. |
||
|
|
Retracted/s From Channel |
The rate of events retracted/deleted from the Rete network via the channel. |
||
|
|
Modified/s From Channel |
The rate of events modified in the Rete network via the channel. |
||
|
|
Fired Rules/s |
The rate of rules fired in the cluster. |
||
|
|
Concept Max Get Avg Time ms |
The longest time taken for a “get” operation for any node in the cluster since the cluster was started (in milliseconds).* |
||
|
|
Max Concept Put Avg Time ms |
The longest time taken for a “put” operation for any node in the cluster since the cluster was started (in milliseconds).* |
||
|
|
Max Concept Remove Avg Time ms |
The longest time taken for a “remove” operation for any node in the cluster since the cluster was started (in milliseconds).* |
||
|
|
Max Concept Op Time |
The longest time taken for a concept operation (get/put/remove) for any node in the cluster since the cluster was started.* |
||
|
|
Concept Gets/s |
The rate of “get” operations in the cluster. |
||
|
|
Concept Puts/s |
The rate of “put” operations in the cluster. |
||
|
|
Concept Removes/s |
The rate of “remove” operations in the cluster. |
||
|
|
Concept Ops/s |
The rate of operations (gets/puts/removes) in the cluster. |
||
|
|
Backing Store Max Erase Time |
The longest time taken for an “erase” operation in the Backing Store for any node in the cluster.* |
||
|
|
Backing Store Max Load Time |
The longest time taken for a “load” operation in the Backing Store for any node in the cluster.* |
||
|
|
Backing Store Max Store Time |
The longest time taken for a “store” operation in the Backing Store for any node in the cluster.* |
||
|
|
Backing Store Max Op Time |
The longest time taken to perform an operation (erase/load/store) in the Backing Store for any node in the cluster.* |
||
|
|
Backing Store Erases/s |
The rate of “erases” in the Backing Store. |
||
|
|
Backing Store Loads/s |
The rate of “loads” into the Backing Store. |
||
|
|
Backing Store Stores/s |
The rate of “stores” into the Backing Store. |
||
|
|
Backing Store Ops/s |
The rate of operations (erases/loads/stores) in the Backing Store. |
||
|
|
Source |
The name of the data server from which the data was collected. |
||
|
|
Expired |
When checked, performance data has not been received within the time specified (in seconds) in the Expire Time field in the Duration region in the RTView Configuration Application > (Project Name) > Solution Package Configuration > TIBCO BusinessEvents > DATA STORAGE tab. The Delete Time field (also in the Duration region) allows you to define the amount of time (in seconds) in which the row will be removed from the table if there is no response. |
||
|
|
Time Stamp |
The date and time, relative to the Data Server, that data was last collected for the engine. |
||


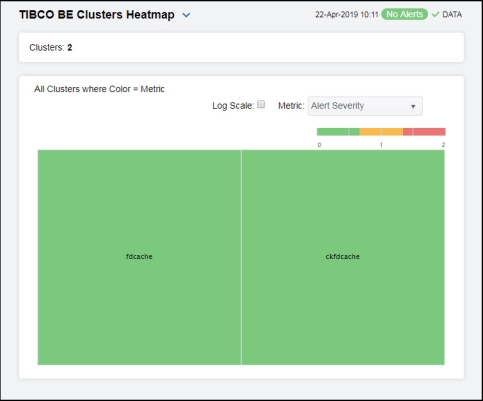
TIBCO BE Clusters Heatmap
Clicking Clusters Heatmap in the left/navigation menu opens the TIBCO BE Clusters Heatmap, which allows you to view the status and alerts of all BE clusters. Use the Metric drop-down menu to view the heatmap using a different metric.
The heatmap is organized so that each rectangle represents a cluster. The rectangle color indicates the most critical alert state. Click on a node to drill-down to the TIBCO BE Cluster Summary display and view metrics for a particular cluster. Toggle between the commonly accessed Table and Heatmap displays by clicking the drop down list on the display title. Mouse-over rectangles to view more details about cluster performance and status.
|
Fields and Data |
||||
|
Clusters |
The number of clusters shown in the heatmap. |
|||
|
All Clusters Heatmap |
||||
|
|
Log Scale |
Select to enable a logarithmic scale. Use Log Scale to see usage correlations for data with a wide range of values. For example, if a minority of your data is on a scale of tens, and a majority of your data is on a scale of thousands, the minority of your data is typically not visible in non-log scale graphs. Log Scale makes data on both scales visible by applying logarithmic values rather than actual values to the data. |
||
|
|
Available Metrics |
Select the metric driving the heatmap display. The default is Alert Severity. Each Metric has a color gradient bar that maps values to colors. The heatmap is organized by clusters, where each rectangle represents a cluster. Mouse-over any rectangle to display the current values of the metrics for the cluster. Click on a rectangle to drill-down to the associated TIBCO BE Cluster Summary display for a detailed view of metrics for that particular cluster.
|
||
|
|
|
Alert Severity |
The maximum level of alerts in the heatmap rectangle. Values range from 0 - 2, as indicated in the color gradient
|
|
|
|
|
Alert Count |
The total number of critical and warning alerts in the heatmap rectangle. The color gradient |
|
|
|
|
Member Count |
The total number of members in the cluster. The color gradient |
|
|
|
|
Events Received |
The number of events received in the cluster. The color gradient |
|
|
|
|
Events Sent |
The number of events sent in the cluster. The color gradient |
|


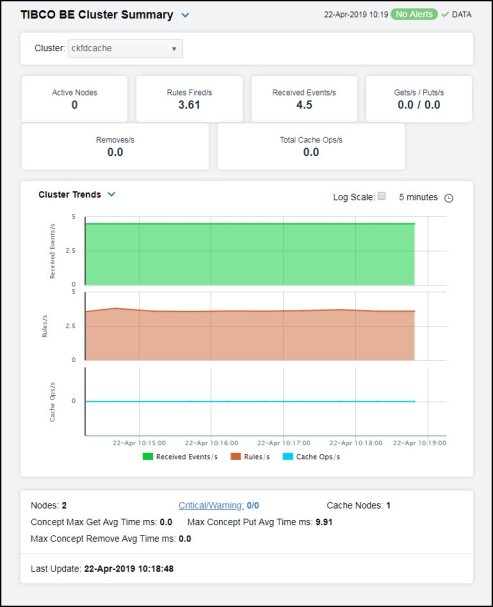
TIBCO BE Cluster Summary
Clicking Cluster Summary in the left/navigation menu opens the TIBCO BE Cluster Summary display, which allows you to view configuration and utilization data for a single cluster. Select a cluster to view Rete statistics, cache metrics, Backing Store data, and trend data for the cluster. Clicking on the information boxes at the top of the display takes you to the TIBCO BE Clusters Table display or the TIBCO BE Events Table display, where you can view additional cluster/event data. There are two options in the trend graph region: Cluster Trends and Backing Store Trends. In the Cluster Trends trend graph region, you can view received event rate, rules fired rate, and cache operations rate over a selected time range. In the Backing Store Trends trend graph region, you can view backing store operations rate and average maximum time per backstore operation over a selected time range. Clicking the Critical/Warning link at the bottom of the display opens the Alerts Table by Component display.
|
Filter By: The display might include these filtering options: |
||||
|
|
Cluster |
Choose a cluster for which you want to see metrics. |
||
|
Fields and Data This display includes: Note: Fields with an asterisk (*) at the end of the field definition contain data that is provided by the TIBCO MBean interface. Refer to TIBCO documentation for more information regarding these fields. |
||||
|
|
Active Nodes |
Lists the number of active nodes on the cluster. |
||
|
|
Rules Fired/s |
The rate of rules fired in the Rete network. |
||
|
|
Received Events/s |
The number of events received since the last data update.* |
||
|
|
Gets/s / Puts/s |
The rate of “get” operations in the L1 cache, and the rate of “put” operations in the cache. |
||
|
|
Removes/s |
The rate of “removes” in the cache. |
||
|
|
Total Cache Ops/s |
The rate of operations (gets/puts/removes) in the cache. |
||
|
|
Trend Graphs |
Cluster Trends Shows the following metrics for the selected cluster. Received Events/s -- Traces the rate of events received in the cluster. Rules/ sec -- Traces the rate of rules in the cluster. Cache Ops/ sec -- Traces the rate of cache operations in the cluster. Backing Store Trends Shows the following metrics for the selected cluster. Backing Store Ops/sec-- Traces the rate of backing store operations in the cluster. Max Backing Store Avg Time-- Traces the average maximum time per backing store operation. |
||
|
|
|
Log Scale |
This option should be used when the range of your data is very broad. When checked, the values are displayed using a logarithmic scale rather than using the actual values so that data on the extreme ends of the scale can be viewed more effectively. For example, if you have data that ranges from the tens to the thousands, the data in the range of the tens will be neglected visually if you do not check this option.
|
|
|
|
|
Time Settings |
Select a time range from the drop down menu varying from 5 Minutes to Last 7 Days. By default, the time range end point is the current time.
To change the time range, deselect the now toggle, which displays some additional date fields. You can click the left and right arrow buttons to decrease the end time by one time period (the time selected in the Time range drop down) per click, or you can choose the date and time from the associated calendar and clock icons. You can also enter the date and time in the text field using the following format: MMM dd, YYYY HH:MM:ss. For example, Aug 21, 2018 12:24 PM. Click the now toggle to reset the time range end point to the current time.
|
|
|
|
Nodes |
Lists the number of nodes on the cluster. |
||
|
|
Concept Max Get Avg Time ms |
The longest time taken for a “get” operation for any node in the cluster since the cluster was started (in milliseconds).* |
||
|
|
Max Concept Remove Avg Time ms |
The longest time taken for a “put” operation for any node in the cluster since the cluster was started.* |
||
|
|
Critical/Warning |
The number of critical and warning alerts on the cluster. |
||
|
|
Max Concept Put Avg Time ms |
The longest time taken for a “put” operation for any node in the cluster since the cluster was started.* |
||
|
|
Cache Nodes |
The number of cache nodes on the cluster. |
||
|
|
Last Update |
The date and time the data was last updated in the display. |
||