BW5 Servers
These displays present performance metrics and alert status for all BW5 servers. Clicking BW5 Servers from the left/navigation menu opens the TIBCO BusinessWorks 5 Servers Table display, which shows all available utilization metrics for all BW5 servers. The options available under BW5 Servers are:
| • | All Servers Heatmap: Opens the TIBCO BusinessWorks 5 Servers Heatmap , which shows server and alert status for all BW5 servers. |
| • | BW5 Server Summary: Opens the TIBCO BusinessWorks 5 Server Summary display, which shows information for a single BW5 server. |
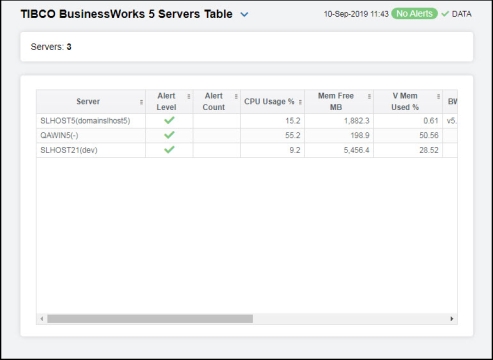
TIBCO BusinessWorks 5 Servers Table
Investigate detailed utilization metrics for all BW servers. The TIBCO BusinessWorks 5 Servers Table contains all metrics available for servers, including CPU usage percentage, free memory, and percentage of virtual memory used. Each row in the table contains data for a particular server. Click a column header to sort column data in ascending or descending order. Double-click on a table row to drill-down to the TIBCO BusinessWorks 5 Server Summary display and view metrics for that particular server. Toggle between the commonly accessed Table and Heatmap displays by clicking the drop down list on the display title.
|
Fields and Data |
||||
|
|
Servers: |
The number of servers listed in the table. |
||
|
Table: |
||||
|
|
Server |
Name of Server Agent. |
||
|
|
Alert Level |
The most critical alert state for alerts in the row:
|
||
|
|
Alert Count |
The total number of active alerts for the application. |
||
|
|
CPU Usage % |
Percent of server CPU in use. |
||
|
|
Mem Free MB |
Available physical memory (MB) remaining. |
||
|
|
V Memory Used % |
Percent of virtual memory used. |
||
|
|
BW Version |
The TIBCO BusinessWorks version currently in use on the server. |
||
|
|
Source |
Name of RTView Data Server sending this data (or localhost). |
||
|
|
Deployed Engines |
Total number of engines deployed on the server. |
||
|
|
Active Engines |
Number of engines currently active. |
||
|
|
Expired |
When checked, data has not been received from this host in the specified amount of time. |
||
|
|
Time Stamp |
Time this data was retrieved. |
||


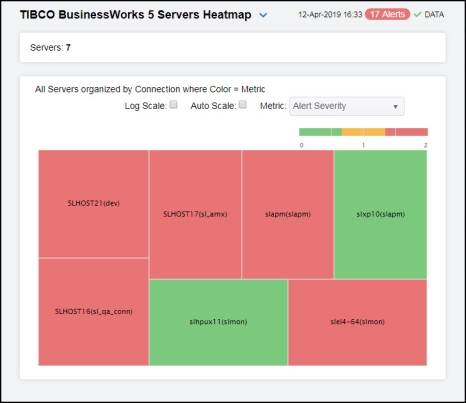
TIBCO BusinessWorks 5 Servers Heatmap
Clicking All Servers Heatmap in the left/navigation menu opens the TIBCO BW5 Servers Heatmap, which allows you to view the status and alerts of all BW5 servers. Use the Metric drop-down menu to view the Alert Severity, Alert Count, CPU Used Percentage, Virtual Memory Used Percentage, Free Memory, Deployed Engines, or Active Engines.
The heatmap is organized by host with each rectangle representing a server. The rectangle color indicates the most critical alert state. Click on a node to drill-down to the TIBCO BusinessWorks 5 Server Summary display and view metrics for a particular server. Toggle between the commonly accessed Table and Heatmap displays by clicking the drop down list on the display title. Mouse-over rectangles to view more details about host performance and status.
|
Fields and Data: |
||||
|
|
Servers: |
The total number of servers in the display. |
||
|
|
Log Scale |
Select to enable a logarithmic scale. Use Log Scale to see usage correlations for data with a wide range of values. For example, if a minority of your data is on a scale of tens, and a majority of your data is on a scale of thousands, the minority of your data is typically not visible in non-log scale graphs. Log Scale makes data on both scales visible by applying logarithmic values rather than actual values to the data. |
||
|
|
Auto Scale |
Select to enable auto-scaling. When auto-scaling is activated, the color gradient bar's maximum range displays the highest value. NOTE: Some metrics auto-scale automatically, even when Auto is not selected. |
||
|
|
Metric |
Select the metric driving the heatmap display. The default is Alert Severity. Each Metric has a color gradient bar that maps values to colors. The heatmap organizes the servers by host, where each rectangle represents a server. Mouse-over any rectangle to display the current values of the metrics for the Server. Click on a rectangle to drill-down to the associated TIBCO BusinessWorks 5 Server Summary display for a detailed view of metrics for that particular server. |
||
|
|
|
Alert Severity |
The maximum level of alerts in the heatmap rectangle. Values range from 0 - 2, as indicated in the color gradient
|
|
|
|
|
Alert Count |
The total number of critical and warning alerts in the heatmap rectangle. The color gradient |
|
|
|
|
CPU Used% |
The percent (%) CPU used in the heatmap rectangle. The color gradient |
|
|
|
|
V(irtual) Memory Used% |
The percent (%) virtual memory used in the heatmap rectangle. The color gradient |
|
|
|
|
Free Memory |
The amount of free memory in the heatmap rectangle, in megabytes. The color gradient |
|
|
|
|
Deployed Engines |
The number of deployed engines in the heatmap rectangle. The color gradient |
|
|
|
|
Active Engines |
The number of active engines in the heatmap rectangle. The color gradient |
|


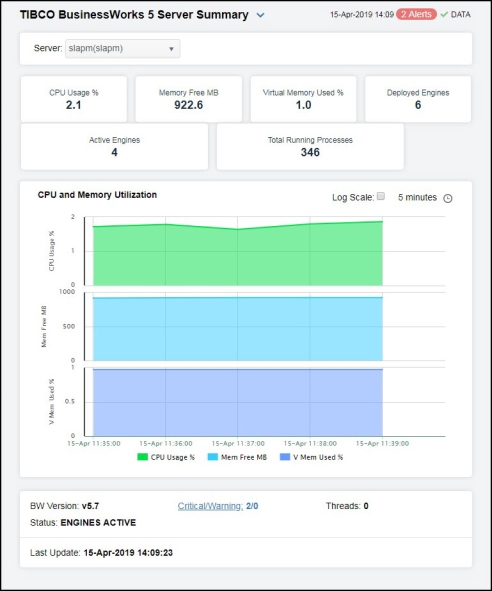
TIBCO BusinessWorks 5 Server Summary
Clicking BW5 Server Summary in the left/navigation menu opens the TIBCO BusinessWorks 5 Server Summary display, which allows you to track utilization and performance metrics for specific BW5 servers. Clicking on the information boxes at the top of the display takes you to the TIBCO BusinessWorks 5 Servers Table display, the TIBCO BusinessWorks 5 Engines Table display, or the TIBCO BusinessWorks 5 Processes Table display (depending on which box you select), where you can view additional servers data. In the CPU and Memory Utilization trend graph region, you can view CPU usage percentage, free memory, and virtual memory used percentage over a selected time range. Clicking the Critical/Warning link at the bottom of the display opens the Alerts Table by Component display.
|
Filter By: The display might include these filtering options: |
||||
|
|
Server: |
Select the server for which you want to see data. |
||
|
Fields and Data |
||||
|
|
CPU Usage % |
Percent of server CPU in use. Click to drill-down to view additional details in the TIBCO BusinessWorks 5 Servers Table display. |
||
|
|
Memory Free MB |
Available physical memory remaining (in MB). Click to drill-down to view additional details in the TIBCO BusinessWorks 5 Servers Table display. |
||
|
|
Virtual Memory Usage % |
Percent of virtual memory used. Click to drill-down to view additional details in the TIBCO BusinessWorks 5 Servers Table display. |
||
|
|
Deployed Engines |
Number of engines currently active. Click to drill-down to view additional details in the TIBCO BusinessWorks 5 Engines Table display. |
||
|
|
Active Engines |
Shows data for the server. Click to drill-down to view additional details in the TIBCO BusinessWorks 5 Engines Table display. |
||
|
|
Total Running Processes |
The number of running processes on this server across all engines. Click to drill-down to view additional details in the TIBCO BusinessWorks 5 Processes Table display. |
||
|
CPU and Memory Utilization Trend Graph |
CPU Usage % -- Traces the percentage of server CPU in use. Mem Free MB -- Traces the available physical memory remaining (in MB). V Mem Used % -- Traces the percentage of virtual memory used. |
|||
|
|
Log Scale |
Select to enable a logarithmic scale. Use Log Scale to see usage correlations for data with a wide range of values. For example, if a minority of your data is on a scale of tens, and a majority of your data is on a scale of thousands, the minority of your data is typically not visible in non-log scale graphs. Log Scale makes data on both scales visible by applying logarithmic values rather than actual values to the data. |
||
|
|
Time Settings |
Select a time range from the drop down menu varying from 5 Minutes to Last 7 Days. By default, the time range end point is the current time.
To change the time range, deselect the now toggle, which displays some additional date fields. You can click the left and right arrow buttons to decrease the end time by one time period (the time selected in the Time range drop down) per click, or you can choose the date and time from the associated calendar and clock icons. You can also enter the date and time in the text field using the following format: MMM dd, YYYY HH:MM:ss. For example, Aug 21, 2018 12:24 PM. Click the now toggle to reset the time range end point to the current time.
|
||
|
BW Version |
The currently deployed version of TIBCO BusinessWorks 5. |
|||
|
Status |
Server status: ACTIVE or EXPIRED. |
|||
|
Critical/Warning |
The number of critical and warning alerts. |
|||
|
Threads |
The number of threads. |
|||
|
Last Update |
The date and time of the last data update. |
|||