FTL Clients
These displays present performance metrics and alert status for FTL clients. Available displays are:
| • | All Clients Heatmap : Shows alert status for all FTL clients in all realms in a heatmap format. |
| • | All Clients Table : Shows all available utilization metrics for all FTL clients on a selected server in a tabular format. |
| • | Single Client Summary : Displays current and historical metrics for a single FTL client. |
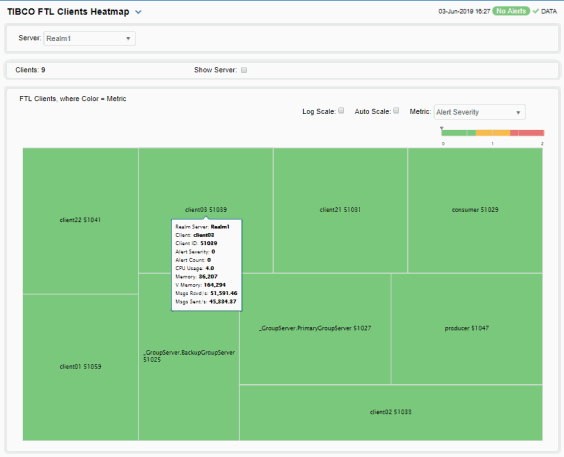
All Clients Heatmap
This heatmap display allows you to quickly identify the current status of all FTL clients on all FTL servers or a particular FTL server. You can view the following metrics: the current Alert Severity, the current Alert Count, Clients (the total number of connected clients), CPU Usage (the current amount of CPU being used), Memory (the current amount of memory being used), V Memory (the current amount of virtual memory being used) and Msgs Rcvd/s and Msgs Sent/s (the number of messages received and sent per second).
Each heatmap rectangle represents a server. The rectangle color indicates the most critical alert state. You can click on a rectangle to drill-down to the Single Client Summary display and view metrics for that server. Clicking on the  icon next to the display title toggles between the commonly accessed Table and Summary displays. Mouse-over the rectangles to view more details about host performance and status. You can view data based on a log scale, which enables visualization on a logarithmic scale and should be used when the range in your data is very broad.
|
Filter By: |
|||
|
|
Server |
Choose the server for which you want to view data. |
|
|
Fields and Data This display includes: |
|||
|
|
Names |
Select this check box to display the names of clients. |
|
|
|
Log |
This option enables visualization on a logarithmic scale, and should be used when the range in your data is very broad. For example, if you have data that ranges from the tens to the thousands, then data in the range of tens will be neglected visually if you do not check this option. This option makes data on both extreme ranges visible by using the logarithmic of the values rather than the actual values. |
|
|
|
Auto |
When checked, the values of the selected metric are auto-scaled to its highest defined value. When unchecked, the values of the selected metric display based on the threshold defined for the alert associated with the selected metric. Selecting Auto helps to visualize the range of the values currently present for the selected metric instead of the threshold of the alert that has been associated with the metric. All metrics that have not been associated in the heatmap defaults with alerts use a monochromatic color gradient bar (whites and greens). All metrics that have been associated in the heatmap defaults with alerts use a multi-chromatic color gradient bar (reds, yellows, white, and greens). |
|
|
|
Metric |
Select the metric driving the heatmap display. The default is Alert Severity. Each Metric has a color gradient bar that maps values to colors. Each rectangle represents a client. Mouse-over any rectangle to display the current values of the metrics for the client. Click on a rectangle to drill-down to the associated Single Client Summary display for a detailed view of metrics for that particular client. |
|
|
|
|
Alert Severity |
The maximum alert level in the item (index) associated with the rectangle. Values range from 0 to 2, as indicated in the color gradient bar 2 Metrics that have exceeded their specified ALARMLEVEL threshold and have an Alert Severity value of 2 are shown in red. For a given rectangle, this indicates that one or more metrics have exceeded their alarm threshold. 1 Metrics that have exceeded their specified WARNINGLEVEL threshold and have an Alert Severity value of 1 are shown in yellow. For a given rectangle, this indicates that one or more metrics have exceeded their warning threshold. 0 Metrics that have not exceeded either specified threshold have an Alert Severity value of 0 and are shown in green. For a given rectangle, this indicates that no metrics have exceeded a specified alert threshold. |
|
|
|
Alert Count |
The total number of alarm and warning alerts in a given item (index) associated with the rectangle. The color gradient bar |
|
|
|
CPU Usage |
The total amount of CPU used. The color gradient bar |
|
|
|
Memory |
The current amount of memory used for processing. The color gradient bar |
|
|
|
V(irtual) Memory |
The current amount of virtual memory being used for processing. The color gradient bar |
|
|
|
Msgs Rcvd/sec |
The rate of messages received (per second). The color gradient bar |
|
|
|
Msgs Sent/sec |
The rate of messages sent (per second). The color gradient bar |
 , where
  shows the range of the value/color mapping. The numerical values in the gradient bar range from
  shows the range of the value/color mapping. The numerical values in the gradient bar range from
  shows the range of the value/color mapping. The numerical values in the gradient bar range from
  shows the range of the value/color mapping. The numerical values in the gradient bar range from
  shows the range of the value/color mapping. The numerical values in the gradient bar range from
  shows the range of the value/color mapping. The numerical values in the gradient bar range from
 All Clients Table
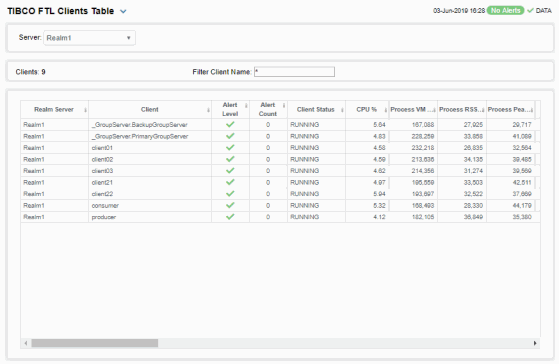
Investigate detailed utilization metrics and configuration settings for all FTL clients. The TIBCO FTL Clients Table contains all metrics available for clients, including the number of current client connections.
Each row in the table contains data for a particular Realm Server. You can search, filter, sort and choose columns to include by clicking a column header icon (to the right of each column label) and selecting Filter, Sort Ascending, Sort Descending or Columns. Or just click a column header to sort.
Right-click on a table cell to Export to Excel or Copy Cell Value.
Investigate a clients by clicking on a row to drill-down to the Single Client Summary display and view details for that client.
Note that the number of clients found in this table might not match the client count found in the FTL Servers Table , possibly due to the following:
| • | One client might have one or more group joins resulting in a higher client count. For example, if a client has two group joins, CLIENT_COUNT equals 3, but will only be listed as a single client in this table. |
| • | A TIBCO bridge could have one or more logical bridges running inside the bridge process, which could result in an increased CLIENT_COUNT even though there is actually only one client. |
| • | Other FTL services could get a Client ID and, hence, be included in the CLIENT_COUNT even though they are not necessarily clients. |
Single Client Summary
Track current and historical performance metrics for a selected FTL client. Use this display to investigate performance issues of a client.
Clicking on the metric boxes at the top of the display takes you to the All Clients Table display, where you can view and compare data against other clients.
Select a Server and Client from the drop-down menus. There are two trend graphs you can choose from:
| • | The Client Compute trend graph traces CPU % (the percent CPU used), Process RSS MB (the current amount of RSS memory used for processes, in megabytes) and Peak Process RSS MB (the maximum amount of RSS memory used for processes, in megabytes). |
| • | The Client Rates trend graph traces CPU % (the percent CPU used), Rcvd Msgs/s (the number of received messages per second) and Sent Msgs/s ((the number of sent messages per second). |
You can hover over the trend graph to see the values at a particular time. You can specify the time range for the trend graph and view data based on a log scale, which enables visualization on a logarithmic scale and should be used when the range in your data is very broad.
Clicking the Critical/Warning link at the bottom of the display opens the Alerts Table by Component display.
