TIBCO BusinessEvents
The HTML version features an overview display, TIBCO BusinessEvents Overview (pictured below), and the following Views which can be found under Components tab > Middleware > TIBCO BusinessEvents.
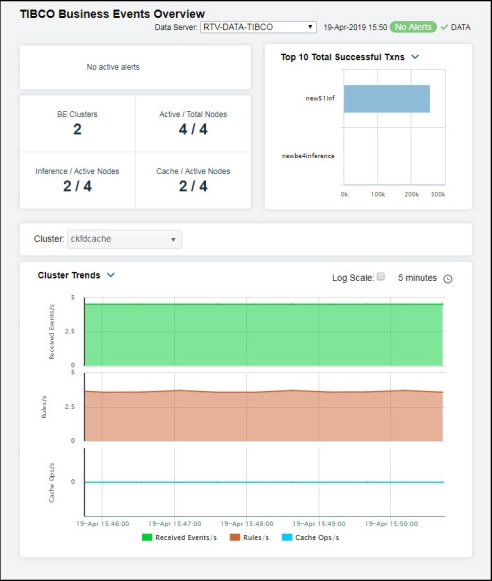
TIBCO BusinessEvents Overview
The TIBCO BusinessEvents Overview is the top-level display for the TIBCO BusinessEvents Monitor, which provides a good starting point for immediately getting the status of all your clusters, nodes, and transactions on your Data Server. You can select the RTView DataServer for which you want to see data and easily view the current data for that DataServer including:
| • | The total number of active alerts for the selected DataServer, including the total number of critical and warning alerts. |
| • | The total number of BE clusters. |
| • | The number of active nodes and the total number of nodes. |
| • | The number of inference nodes and cache nodes. |
| • | A visual list of the top 10 servers containing the total successful transactions/total database transactions completed/hit ratio on your connected DataServer. |
You can hover over each region in the upper half of the Overview to see more detail. You can also drill down to see even more detail by clicking on each respective region in the Overview. For example, clicking on the alerts in the CRITICAL and WARNING alerts region opens the Alerts Table by Components display.
The bottom half of the display provides Cluster and Backing Store trend graphs for a selected server. You can hover over the trend graph to see the values at a particular time. You can specify the time range for the trend graph and view data based on a log scale, which enables visualization on a logarithmic scale and should be used when the range in your data is very broad.
The TIBCO BusinessEvents Monitor contains the following Views:
| • | BE Clusters |
| • | BE Nodes |
| • | BE Events |
| • | BE Concepts |