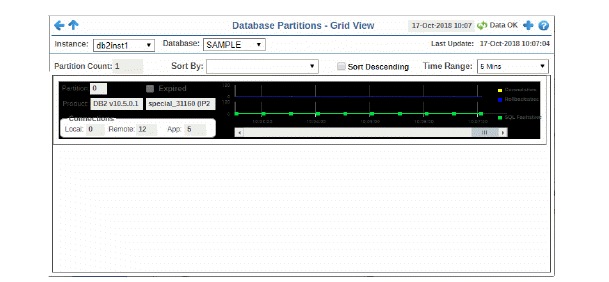
This display provides a grid view of a subset of data in the Partition Table display.
Each grid object is a different partition on the selected database. Each has a trend graph that traces the Commits per second, Rollbacks per second and SQL Faults per second for the partition. Choose a Time Range for the trend graph to trace, or select All Data to include all available data in the trace. Scroll forward and backward in the trend graph and click Reset to return to the original state.
Show Expired databases first using Sort By: Expired. Or sort by partition name. Toggle Sort Descending to order the grid objects.
Investigate performance metrics details for a databasein the Database Summary display by clicking on the (left or right side of the) grid object.


|
Instance: |
Select an instance. |
|||
|
Database: |
Select a database. |
|||
|
Partition Count: |
The number of partitions in the display. |
|||
|
Sort By: |
Orders the grid objects as follows:
|
|||
|
Sort Descending |
Toggle on to order the grid objects. |
|||
|
Time Range |
Choose a time range for the trend graph to trace, from 2 minutes to 7 days, or choose All Data to include all available data. The selected time range applies to all grid objects in the display. |
|||
|
Grid Objects |
Each grid object is a different partition and values describe the partition. |
|||
|
|
Partition |
The partition number. |
||
|
|
Expired |
When checked, performance data has not been received within the time specified by your administrator for the Expire Time. If your administrator has also set the Delete Time, this grid object will be deleted if no data is received within the time specified for deletion. |
||
|
|
Product |
The name of the software and version. |
||
|
|
Connections |
|
||
|
|
Trend Graph |
|
||