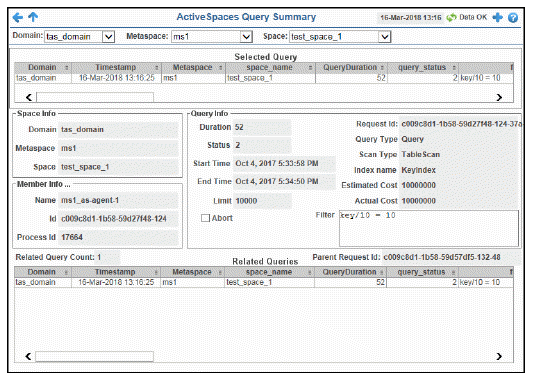
This display allows you to view performance metrics for a particular query, as well as to view any related queries. Data only appears in this display when you select a query from the All Queries Table.


Note: Fields/columns with an asterisk (*) at the end of the field/column definition contain data that is provided by the selected domain. Refer to TIBCO ActiveSpaces documentation for more information regarding these fields.
|
Filter By: The display might include these filtering options: |
||||
|
|
Domain |
Select the domain for which you want to show data in the display. |
||
|
|
Metaspace |
Select the metaspace for which you want to show data in the display. |
||
|
|
Space |
Select the space for which you want to show data in the display. |
||
|
Fields and Data: |
||||
|
|
Selected Query |
Lists the details of the query selected from the All Queries Table. |
||
|
Space Info |
||||
|
|
Domain |
The name of the domain in which the query resides. |
||
|
|
Metaspace |
The name of the metaspace in which the query resides. |
||
|
|
Space |
The name of the space in which the query resides. |
||
|
Member Info |
Note: You can click this region to open the Member Summary display. |
|||
|
|
Name |
The name of the member node.* |
||
|
|
Id |
The id of the member node.* |
||
|
|
Process ID |
The process ID of the member node processing the query.* |
||
|
Query Info |
|
|||
|
|
Duration |
The duration, in seconds, of the query.* |
||
|
|
Status |
The status of the query.* 0 - Failed 1 - In progress 2 - Completed |
||
|
|
Start Time |
Start time of the query. |
||
|
|
End Time |
End time of the query. |
||
|
|
Limit |
Lists the maximum number of entries that can be returned when executing a query.* |
||
|
|
Abort |
When checked, denotes that the query was aborted.* |
||
|
|
Request Id |
The request id of the query.* |
||
|
|
Query Type |
The type of query.* |
||
|
|
Scan Type |
Lists whether the query used a table scan or an index scan.* |
||
|
|
Index Name |
The name of the index being used in the query.* |
||
|
|
Estimated Cost |
The estimated execution time of the query.* |
||
|
|
Actual Cost |
The actual execution time of the query.* |
||
|
|
Filter |
The filter used in the query.* |
||
|
Related Query Count |
The number of queries related to the selected query. |
|||
|
Parent Request Id |
The request ID of the query’s parent. |
|||
|
Related Queries |
Lists the details of any related (“sibling”) queries. |
|||