DB2 Instances View
Displays in this View are:
| • | DB2 Instances Table |
| • | DB2 Instances Heatmap |
| • | Instance Summary |
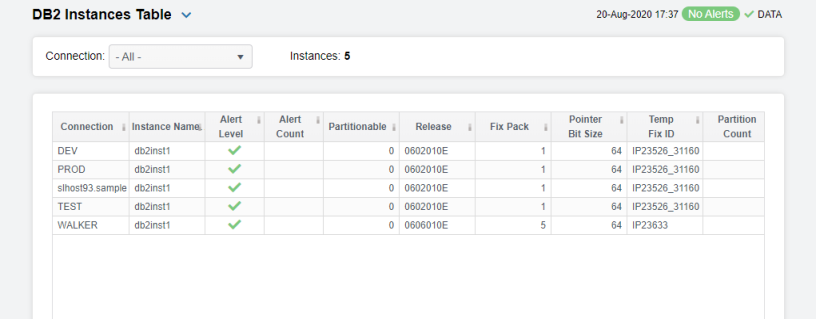
DB2 Instances Table
Investigate detailed configuration information for all DB2 instances. This display provides a list of all DB2 instances with details about Partition Counts and Pointer Bit Sizes, as well as Fix Packs, Service Levels, number of MonitoredDBs and the most critical Alert Levels.
Each row in the table is a different DB2 instance. Click a column header to sort column data in numerical or alphabetical order. Investigate by double-clicking a row to view details for an instance in the Instance Summary display.
Click right corner of column headers to filter and sort data as well as to choose columns to include in the display.
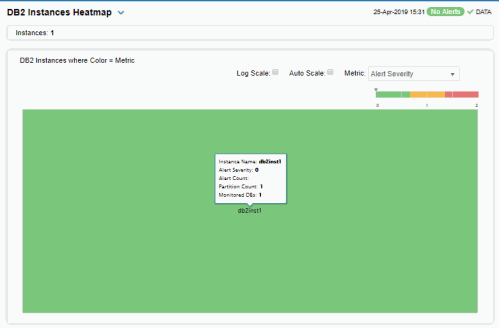
DB2 Instances Heatmap
View current alert status and performance metrics of all or just one of your IBM DB2 instances.
Answer questions such as, Are any instances reaching a state of critical health? Is the monitoring load evenly distributed across instances and partitions?
Each rectangle in the heatmap represents a different instance, where the rectangle color indicates the most critical alert state for items associated with that instance and the metric selected. The rectangle size represents the tablespace allocation size for the instance.
By default, the Alert Severity metric is shown. Values range from 0 - 2, as indicated in the color gradient  bar:
bar:
 (2) Red indicates that one or more metrics exceeded their ALARM LEVEL threshold.
 (1) Yellow indicates that one or more metrics exceeded their WARNING LEVEL threshold.
 (0) Green indicates that no metrics have exceeded their alert thresholds.
Use the Metric drop-down menu to view Alert Severity, Alert Count, Partition Count and Monitored DBs.
Mouse-over rectangles to view more details about host performance and status. Toggle between the commonly accessed Table and Heatmap displays by clicking the drop down list on the display title.
You can view data based on a log scale, which enables visualization on a logarithmic scale and should be used when the range in your data is very broad.
Click a rectangle to investigate an instance in the Instance Summary display.
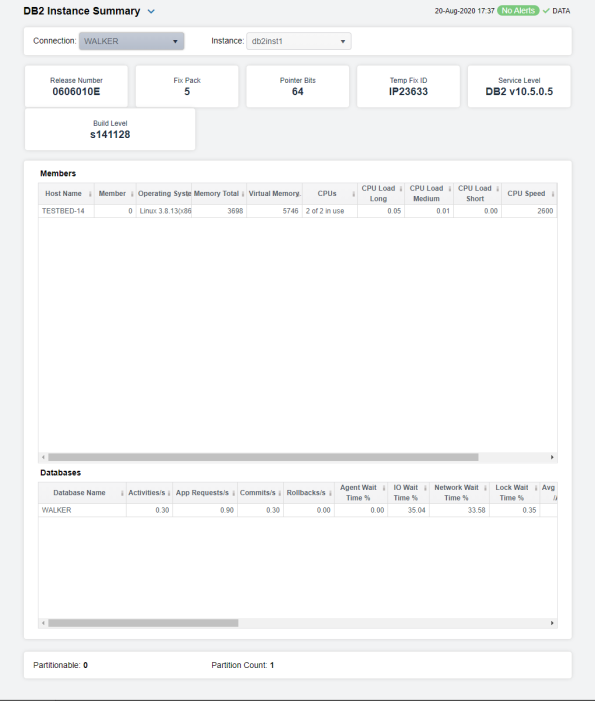
Instance Summary
Select an Instance to see the following information for that instance:
The Instance Members table shows resource allocation and configuration details (CPU Load, Memory) for members (hosts) on a single IBM DB2 instance. Click a row to drill-down to details in the DB2 Member Summary display.
The Instance Databases table shows utilization and processing metrics for databases on a single IBM DB2 instance. Click a row to drill-down to details in the Single DB2 Database Summary display.
|
Instance Members Table Each row is a different host member. Column values describe the host. |
||||
|
Member Count: |
The number of members in the table. |
|||
|
|
Host Name |
The name of the host. |
||
|
|
Expired |
When checked, performance data has not been received within the time specified by your administrator for the Expire Time. If your administrator has also set the Delete Time, this row will be deleted if no data is received within the time specified for deletion. |
||
|
|
Member |
The member number. |
||
|
|
OS |
The installed operating system. |
||
|
|
CPUs |
The number of CPUs and the number of CPUs in use. |
||
|
|
CPU Speed |
The processor speed. |
||
|
|
Total RAM |
The total amount of RAM, in megabytes. |
||
|
|
Total Virtual Memory |
The total amount of virtual memory, in megabytes. |
||
|
|
CPU Load Short |
Amount of processor load over the short term (defined by the IBM DB2 system, for example, 1-5 minutes). |
||
|
|
CPU Load Medium |
Amount of processor load over the medium term (defined by the IBM DB2 system, for example, 5-10 minutes). |
||
|
|
CPU Load Long |
Percentage of CPU load over the long term (defined by the IBM DB2 system, for example, 10-15 minutes). |
||
|
|
% CPU Usage |
The percentage of CPU used. |
||
|
Instance Databases Table Each row is a different database. Column values describe the database. |
||||
|
Database Count: |
The number of databases in the table. |
|||
|
|
Database |
The name of the database. |
||
|
|
Expired |
When checked, performance data has not been received within the time specified by your administrator for the Expire Time. If your administrator has also set the Delete Time, this row will be deleted if no data is received within the time specified for deletion. |
||
|
|
Connected |
When checked, the database is connected. |
||
|
|
Severity |
The alert status:
|
||
|
|
Response Time |
The response time, in milliseconds. |
||
|
|
I/O Wait Time % |
The percentage wait time taken by I/O operations. |
||
|
|
Network Wait Time % |
The percentage wait time taken by the network. |
||
|
|
Agent Wait Time % |
The percentage wait time taken by agents. |
||
|
|
Avg Deadlocks per Activity |
The average number of application deadlocks per activity. |
||
|
|
Avg Lock Escalations per Activity |
The average number of application deadlock escalations per activity. |
||
|
|
Avg Lock Timeouts per Activity |
The average number of application deadlock timeouts per activity. |
||
|
|
Avg Lock Waits per Activity |
The average number of application deadlock waits per activity. |
||
|
|
Rows Read per Rows Returned |
The number of rows read per number of rows returned. |
||
|
|
Activities/sec |
The number of activities per second. |
||
|
|
App Requests/sec |
The number of application requests per second. |
||
|
|
Commits/sec |
The number of application commits per second. |
||
|
|
Rollbacks/sec |
The number of application rollbacks per second. |
||
|
|
Buffer Pool Hit Ratio % |
The current buffer pool hit ratio, which is the total number of pool hits divided by the total number of buffer pool lookups. |
||
|
|
Activity Wait Time % |
The percentage wait time taken by activities. |
||
|
|
Avg Request CPU Time |
The average amount of CPU time used by requests, in seconds. |
||
|
|
Compile Proc Time % |
The percentage of time used for compiling processes. |
||
|
|
Routine Time Request % |
The percentage of time used for routine request processes. |
||
|
|
Section Time % |
The percentage of time used for section processes. |
||
|
|
Section Sort Time % |
The percentage of time used for sorting section processes. |
||
|
|
BP Hit Ratio % |
The current buffer pool hit ratio, which is the total number of pool hits divided by the total number of buffer pool lookups. |
||
|
|
Transaction Time % |
The percentage of time used for transaction processes. |
||
|
|
Utils Proc Time % |
The percentage of time used for utilities processes. |
||
|
|
Timestamp |
The data and time this data was last updated. |
||


