BE Nodes
These displays present performance metrics and alert status for your BusinessEvents nodes. Clicking BE Nodes from the left/navigation menu opens the TIBCO BE Cluster Nodes Table display, which shows all available utilization metrics for all BE nodes. The options available under BE Nodes are:
| • | Cluster Nodes Heatmap: Opens the TIBCO BE Cluster Nodes Heatmap , which shows cluster and alert status for all BE cluster nodes. |
| • | Inference Node Summary: Opens the TIBCO BE Inference Node Summary display, which shows information for (inference) agents for a single BE cluster node. |
| • | Storage Node Summary: Opens the TIBCO BE Storage Node Summary display, which displays cache data for a specific node. |
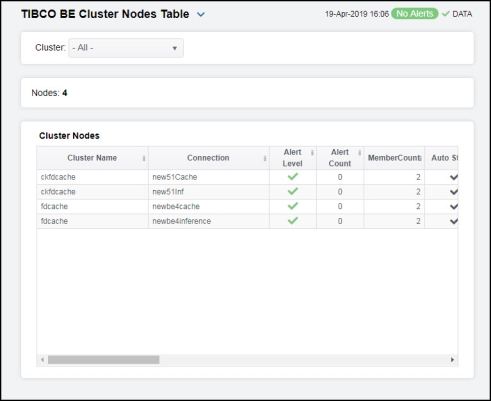
TIBCO BE Cluster Nodes Table
Use this display to view configuration and utilization data for nodes in a cluster. Each row in the table contains data for a particular node. Click a column header to sort column data in ascending or descending order. Toggle between the commonly accessed Table, Heatmap, and Summary displays by clicking the drop down list on the display title.
|
Filter By: The display might include these filtering options: |
||||
|
|
Cluster |
Choose a cluster for which you want to see metrics. |
||
|
Cluster Nodes Table Each row in the table is a different node. Data in the row columns describe the node. Note: Row columns in this table with an asterisk (*) at the end of the column definition contain data that is provided by the TIBCO MBean interface. Refer to TIBCO documentation for more information regarding these columns. |
||||
|
|
Nodes: |
The total number of clusters in the table. |
||
|
|
Cluster Name |
The name of the TIBCO BusinessEvents cluster. |
||
|
|
Connection |
The name of the node. |
||
|
|
Alert Level |
The severity level of open alerts. Values range from 0 to 2, where 2 is the greatest Severity:
|
||
|
|
Alert Count |
The total number of critical and warning alerts. |
||
|
|
Member Count |
The number of neighbors seen by a given node. This value is obtained directly from each node in the cluster. This value should always match the total “Member Count” in the corresponding row of the Clusters table. If they do not match, the node did not join the cluster properly and, hence, the cluster should be restarted. |
||
|
|
Auto Startup |
When checked (true), this feature is enabled. |
||
|
|
Backing Store Enabled |
When checked (true), this feature is enabled.* |
||
|
|
Cache Aside |
When checked (true), this feature is enabled.* |
||
|
|
Serialization Optimized |
When checked (true), this feature is enabled.* |
||
|
|
Storage Enabled |
When checked (true), this feature is enabled.* |
||
|
|
Cache Type |
The type of TIBCO BusinessEvents cache.* |
||
|
|
BE Version |
The approximate TIBCO BusinessEvents version, as configured by the connection property. The exact version information is not available via JMX. |
||
|
|
isCacheNode? |
When checked (true), the node is a storage node. Otherwise, it is an inference node. This column is added by the Monitor rather than read from the JMX interface. |
||
|
|
Node ID |
A unique string that identifies the node. |
||
|
|
CPU % |
The amount of CPU, in percent, used by the node. This value is derived from the java.lang.OperatingSystem MBean. |
||
|
|
Max Heap |
The maximum amount of memory, in megabytes, that can be used by the JVM for heap space. This value is provided by standard Java MBeans. |
||
|
|
Used Heap |
The current amount of memory, in megabytes, in use by the JVM for heap space. This value is provided by standard Java MBeans. |
||
|
|
NonHeapMemoryUsage.max |
The maximum amount of memory, in megabytes, that can be used by the process (not counting heap usage). This value is provided by standard Java MBeans. |
||
|
|
NonHeapMemoryUsage.Used |
The current amount of memory, in megabytes, in use by the process (not counting heap usage). This value is provided by standard Java MBeans. |
||
|
|
Connected |
When checked (true), the node is currently connected to the Data Server via JMX. |
||
|
|
Expired |
When checked, performance data has not been received within the time specified (in seconds) in the Expire Time field in the Duration region in the RTView Configuration Application > (Project Name) > Solution Package Configuration > TIBCO BusinessEvents > DATA STORAGE tab. The Delete Time field (also in the Duration region) allows you to define the amount of time (in seconds) in which the row will be removed from the table if there is no response. |
||
|
|
Time Stamp |
The date and time, relative to the Data Server, that data was last collected for the node. |
||


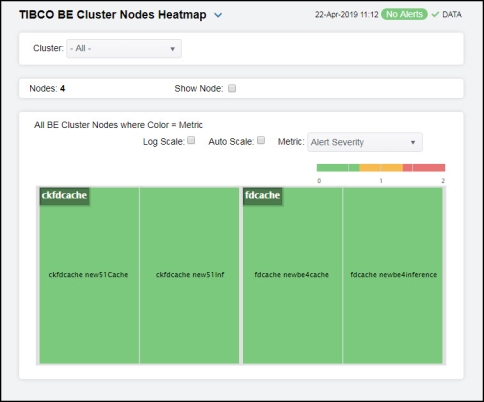
TIBCO BE Cluster Nodes Heatmap
Clicking Cluster Nodes Heatmap in the left/navigation menu opens the TIBCO BE Cluster Nodes Heatmap, which allows you to view utilization data for all nodes in a cluster in a heatmap format. Use the Metric drop-down menu to view the heatmap based on a different metric.
The heatmap is organized so that each rectangle represents a node. The rectangle color indicates the most critical alert state. Toggle between the commonly accessed Table and Heatmap displays by clicking the drop down list on the display title. Mouse-over rectangles to view more details about cluster performance and status.
|
Filter By: The display might include these filtering options: |
|||||
|
|
Cluster |
Choose a cluster for which you want to see metrics. |
|||
|
|
Nodes: |
The total number of nodes in the display. |
|||
|
|
Show Node |
Select this check box to display the name of the node in each rectangle in the heatmap. |
|||
|
|
Log Scale |
Select to enable a logarithmic scale. Use Log Scale to see usage correlations for data with a wide range of values. For example, if a minority of your data is on a scale of tens, and a majority of your data is on a scale of thousands, the minority of your data is typically not visible in non-log scale graphs. Log Scale makes data on both scales visible by applying logarithmic values rather than actual values to the data.
|
|||
|
|
Auto Scale |
When checked, the values of the selected metric are auto-scaled to its highest defined value. When unchecked, the values of the selected metric display based on the threshold defined for the alert associated with the selected metric. Selecting Auto helps to visualize the range of the values currently present for the selected metric instead of the threshold of the alert that has been associated with the metric. All metrics that have not been associated in the heatmap defaults with alerts use a monochromatic color gradient bar (whites and greens). All metrics that have been associated in the heatmap defaults with alerts use a multi-chromatic color gradient bar (reds, yellows, white, and greens). |
|||
|
|
Available Metrics |
Select the metric driving the heatmap display. The default is Alert Severity. Each Metric has a color gradient bar that maps values to colors. The heatmap is organized by nodes, where each rectangle represents a node. Mouse-over any rectangle to display the current values of the metrics for the node. |
|||
|
|
|
Alert Severity |
The maximum alert level in the item (index) associated with the rectangle. Values range from 0 to 2, as indicated in the color gradient bar 2 -- Metrics that have exceeded their specified ALARMLEVEL threshold and have an Alert Severity value of 2 are shown in red. For a given rectangle, this indicates that one or more metrics have exceeded their alarm threshold. 1 -- Metrics that have exceeded their specified WARNINGLEVEL threshold and have an Alert Severity value of 1 are shown in yellow. For a given rectangle, this indicates that one or more metrics have exceeded their warning threshold. 0 -- Metrics that have not exceeded either specified threshold have an Alert Severity value of 0 and are shown in green. For a given rectangle, this indicates that no metrics have exceeded a specified alert threshold. |
||
|
|
|
Alert Count |
The total number of alarm and warning alerts in a given item (index) associated with the rectangle. The color gradient bar |
||
|
|
|
JVM % CPU Used |
The total percentage of JVM CPU used in a given item (index) associated with the rectangle. The color gradient bar |
||
|
|
|
JVM % Heap Used |
The total percentage of JVM Heap Memory Used in a given item (index) associated with the rectangle. The color gradient bar |
||
 , where
  shows the range of the value/color mapping. The numerical values in the gradient bar range from
  shows the range of the value/color mapping. By default, the numerical values in the gradient bar range from
  shows the range of the value/color mapping. By default, the numerical values in the gradient bar range from
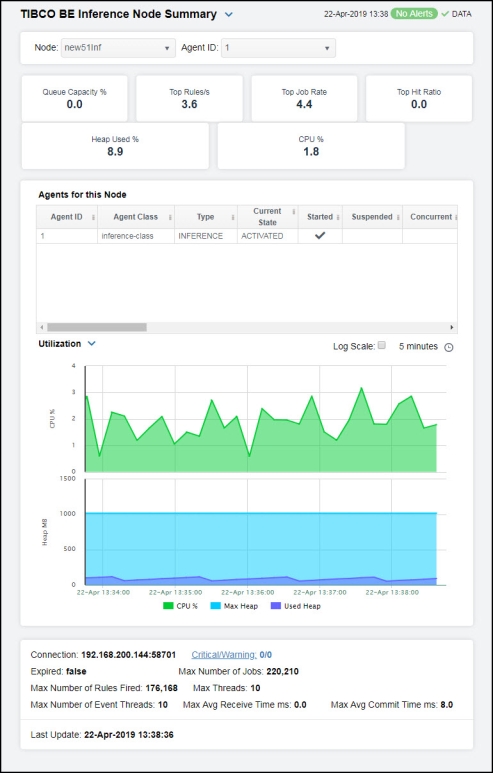
TIBCO BE Inference Node Summary
Clicking Inference Node Summary in the left/navigation menu opens the TIBCO BE Inference Node Summary display, which allows you to view configuration and utilization data for a single inference node. View a list of all agents on the node and trend graphs tracing the rule execution rate for agents on the node. The rule execution rate is relative to the overall CPU and heap utilization for the engine's JVM.
NOTE: An inference node (also known as an engine or processing unit) is the container where one or more inference agents run. Generally, the agents in a given node implement different rule sets, and distributing nodes on different hosts provides fault tolerance and load balancing for the cluster. For details, refer to TIBCO documentation.
Clicking on the information boxes at the top of the display takes you to the TIBCO BE Clusters Table display, the TIBCO BE Agent Event Summary display, or the JVM Summary display, where you can view additional cluster/event/JVM data. The Agents for this Node region lists the inference agents associated with the selected node. There are two options in the trend graph region: Utilization and Rules/s and Threads. In the Utilization trend graph region, you can view percentage of CPU being used by the engine/process and the amount of memory, in megabytes, in use by the JVM for heap space over a selected time range. In the Rules/s and Threads trend graph region, you can view the rate of rules fired for the agent and the total number of threads for the agent over a selected time range. Clicking the Critical/Warning link at the bottom of the display opens the Alerts Table by Component display.
|
Filter By: The display might include these filtering options: |
||||
|
|
Node |
Select a node for which you want to view metrics. |
||
|
|
Agent ID |
Select the agent ID for which you want to view metrics. |
||
|
Fields and Data: Note: Fields in this display with an asterisk (*) at the end of the field definition contain data that is provided by the TIBCO MBean interface. Refer to TIBCO documentation for more information regarding these fields. |
||||
|
|
Queue Capacity % |
The queue capacity for the agent.* |
||
|
|
Top Rules/s |
The maximum rules fired per second for all inference agents from the selected node. |
||
|
|
Top Job Rate |
The maximum number of jobs per second across all inference agents from the selected node. |
||
|
|
Top Hit Ratio |
The maximum hit ratio across all inference agents from the selected node. |
||
|
|
Heap Used % |
The percent heap utilization of this inference node. |
||
|
|
CPU % |
The percentage of CPU utilization on this inference node. |
||
|
Agents for this Node Table Each row in the table is an agent associated with the node, with data in the row columns describing the agent. Note: Row columns in this table with an asterisk (*) at the end of the column definition contain data that is provided by the TIBCO MBean interface. Refer to TIBCO documentation for more information regarding these columns. |
||||
|
|
Agent ID |
The agent’s ID. |
||
|
|
Agent Class |
The agent’s class. See TIBCO documentation for more information. |
||
|
|
Type |
The type of agent (Inference, Cache, Query, or Dashboard).* |
||
|
|
Current State |
The current state of the agent.* |
||
|
|
Started |
When checked, denotes that the agent is started.* |
||
|
|
Suspended |
When checked, denotes that the agent is suspended.* |
||
|
|
Concurrent |
When checked, denotes that it is a concurrent agent.* |
||
|
|
Queue Capacity |
The queue capacity for the agent.* |
||
|
|
Queue Size |
The queue size for the agent.* |
||
|
|
Thread Count |
The total number of threads for the agent.* |
||
|
|
Total # Rules Fired |
The total number of rules fired for the agent.* |
||
|
|
Rules Fired |
The number of rules fired.* |
||
|
|
Rules/s |
The rate of rules fired for the agent. |
||
|
|
Avg Receive Time |
See TIBCO documentation for more information.* |
||
|
|
Avg Txn Commit Time |
The average amount of time taken to commit a transaction.* |
||
|
|
Cache Queue Remaining |
The total amount of remaining space on the cache queue.* |
||
|
|
DB Ops Queue Remaining |
The total amount of remaining space on the DB Operations queue.* |
||
|
|
Hit Ratio |
See TIBCO documentation for more information.* |
||
|
|
Job Rate |
See TIBCO documentation for more information.* |
||
|
|
L1 Cache Max Size |
The maximum size of the L1 cache.* |
||
|
|
L1 Cache Size |
The current size of the L1 cache.* |
||
|
|
Max Active |
See TIBCO documentation for more information.* |
||
|
|
# Event Threads |
The total number of currently active event threads.* |
||
|
|
# Jobs |
The total number of currently active jobs.* |
||
|
|
Priority |
See TIBCO documentation for more information.* |
||
|
|
Read Only |
See TIBCO documentation for more information.* |
||
|
|
Txn Commit Count |
The number of transactions committed by the agent.* |
||
|
|
Txn Receive Count |
The number of transactions received by the agent.* |
||
|
|
Expired |
When checked, performance data has not been received within the time specified (in seconds) in the Expire Time field in the Duration region in the RTView Configuration Application > (Project Name) > Solution Package Configuration > TIBCO BusinessEvents > DATA STORAGE tab. The Delete Time field (also in the Duration region) allows you to define the amount of time (in seconds) in which the row will be removed from the table if there is no response. |
||
|
|
Time Stamp |
The date and time, relative to the Data Server, that data was last collected for the agent. |
||
|
Trend Graph |
Utilization Shows metrics for the selected node. % CPU -- Traces the amount of CPU used, in percent, by the node. Max Heap -- Traces the maximum amount of heap space, in bytes, used by the node since the agent was started. Used Heap -- Traces the current amount of heap space, in bytes, used by the agent. Rules/s and Threads Shows metrics for the selected node. Rules/s -- Traces the number of rules processed, per second, by the agent. Thread Count-- Traces the number of threads being used by the node. |
|||
|
|
|
Log Scale |
This option should be used when the range of your data is very broad. When checked, the values are displayed using a logarithmic scale rather than using the actual values so that data on the extreme ends of the scale can be viewed more effectively. For example, if you have data that ranges from the tens to the thousands, the data in the range of the tens will be neglected visually if you do not check this option.
|
|
|
|
|
Time Settings |
Select a time range from the drop down menu varying from 5 Minutes to Last 7 Days. By default, the time range end point is the current time.
To change the time range, deselect the now toggle, which displays some additional date fields. You can click the left and right arrow buttons to decrease the end time by one time period (the time selected in the Time range drop down) per click, or you can choose the date and time from the associated calendar and clock icons. You can also enter the date and time in the text field using the following format: MMM dd, YYYY HH:MM:ss. For example, Aug 21, 2018 12:24 PM. Click the now toggle to reset the time range end point to the current time.
|
|
|
|
Connection |
The JMX connection method specified in the connection property for a given engine. It is displayed as either a combination of the host and port fields (<host>:<port>), or the URL. This convention saves space on the display by avoiding empty fields. This information is provided as a convenience for those rare occasions where a user might wish to view the data directly in jconsole. |
||
|
|
Max Number of Jobs |
The maximum number of jobs.* |
||
|
|
Max Number of Event Threads |
The maximum number of event threads.* |
||
|
|
Critical/ Warning |
The number of critical and warning alerts. |
||
|
|
Max Number of Rules Fired |
The maximum rules fired for all inference agents from the selected node. |
||
|
|
Max Avg Receive Time ms |
The maximum average receive time for all inference agents from the selected node. |
||
|
|
Expired |
When checked, performance data has not been received within the time specified (in seconds) in the Expire Time field in the Duration region in the RTView Configuration Application > (Project Name) > Solution Package Configuration > TIBCO BusinessEvents > DATA STORAGE tab. The Delete Time field (also in the Duration region) allows you to define the amount of time (in seconds) in which the row will be removed from the table if there is no response. |
||
|
|
Max Threads |
The maximum number of threads on the selected node. |
||
|
|
Max Avg Commit Time ms |
The maximum average commit time, in milliseconds, for all inference agents on the selected node. |
||
|
|
Last Update |
The date and time the data in the display was last updated. |
||
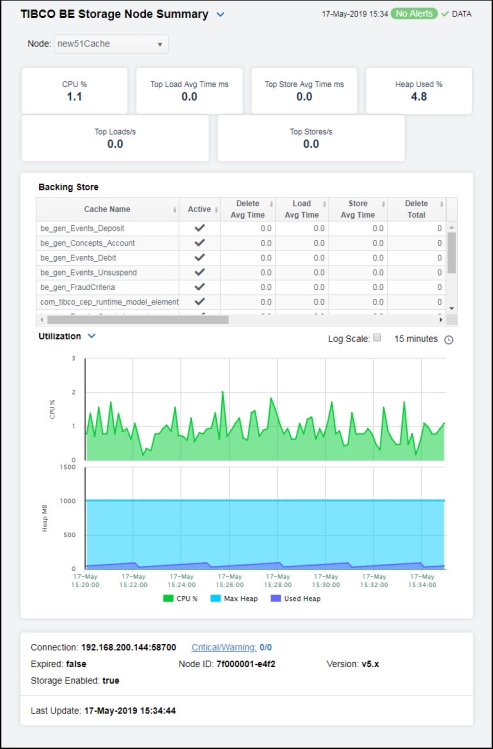
TIBCO BE Storage Node Summary
Clicking Storage Node Summary in the left/navigation menu opens the TIBCO BE Storage Node Summary display, which allows you to view configuration details for a single cache node and a list of all caches that are backed by the backing store (database).
NOTE: A storage node (also known as a cache node) provides fast access to events and concepts required during each RTC by the inference engines. Storage nodes also serve as buffers for reads and writes between the cluster and the backing store. For details, refer to TIBCO documentation.
Clicking on the information boxes at the top of the display takes you to the JVM Summary display, where you can view additional JVM data. The Backing Store region lists the caches that are backed by the backing store in the selected node. There are two options in the trend graph region: Utilization and Table Sizes. In the Utilization trend graph region, you can view percentage of CPU being used by the node and the amount of memory, in megabytes, in use by the JVM for heap space over a selected time range. In the Table Sizes trend graph region, you can view the number of unique objects cached in the local index table and the number of entries in the table of external IDs used as indexes by the backing store over a selected time range. Clicking the Critical/Warning link at the bottom of the display opens the Alerts Table by Component display.
|
Filter By: The display might include these filtering options: |
||||
|
|
Node: |
Select the node for which you want to see metrics. |
||
|
Fields and Data |
||||
|
|
CPU % |
The amount of CPU, in percent, used by the node. This value is provided by standard Java MBeans. |
||
|
|
Top Load Avg Time ms |
The maximum load average time, in milliseconds, across all backing stores of this storage node. |
||
|
|
Top Store Avg Time ms |
The maximum average store time, in milliseconds, across all backing stores of this storage node. |
||
|
|
Heap Used % |
The percentage of heap utilization of this storage node. |
||
|
|
Top Loads/s |
The maximum number of loads per second across all backing stores of this storage node. |
||
|
|
Top Stores/s |
The maximum number of stores per second across all backing stores of this storage node. |
||
|
Backing StoreTable A cache node manages access to current events and concepts, buffering as necessary between local memory and a database. The Backing Store table provides a list of caches and the database select/insert/delete statistics for each cache. Note: Row columns in this table with an asterisk (*) at the end of the column definition contain data that is provided by the TIBCO MBean interface. Refer to TIBCO documentation for more information regarding these columns. |
||||
|
|
Cache Name |
The name of the cache.* |
||
|
|
Active |
When checked, denotes that the cache is active.* |
||
|
|
Delete Avg Time |
The average amount of time taken for a “delete” (“erase”) operation in the Backing Store for the cache.* |
||
|
|
Load Avg Time |
The average amount of time taken for a “load” operation in the Backing Store for the cache.* |
||
|
|
Store Avg Time |
The average amount of time taken for a “store” operation in the Backing Store for the cache.* |
||
|
|
Delete Total |
The total number of “delete” operations in the Backing Store for the cache.* |
||
|
|
Load Total |
The total number of “load” operations in the Backing Store for the cache.* |
||
|
|
Store Total |
The total number of “store” operations in the Backing Store for the cache.* |
||
|
|
Deletes |
The number of “delete” operations during the last polling interval.* |
||
|
|
Loads |
The number of “load” operations during the last polling interval.* |
||
|
|
Stores |
The number of “store” operations during the last polling interval.* |
||
|
|
Deletes/s |
The rate of “delete” operations in the node. |
||
|
|
Loads/s |
The rate of “load” operations in the node. |
||
|
|
Stores/s |
The rate of “store” operations in the node. |
||
|
|
Expired |
When checked (true), performance data has not been received within the time specified (in seconds) in the Expire Time field in the Duration region in the RTView Configuration Application > (Project Name) > Solution Package Configuration > TIBCO BusinessEvents > DATA STORAGE tab. The Delete Time field (also in the Duration region) allows you to define the amount of time (in seconds) in which the row will be removed from the table if there is no response. |
||
|
Trend Graphs |
Utilization Shows metrics for the selected cluster/node combination: % CPU -- Traces the amount of CPU used, in percent, by the engine. Max Heap (MB)-- Traces the maximum amount of memory, in megabytes, that can be used by the JVM for heap space. Used Heap (MB) -- Traces the used heap space, in megabytes, in use by the JVM. Table Sizes Shows metrics for the selected cluster/node combination: Table Size -- Traces the number of unique objects cached in the local index table. Ext ID Tbl Size -- Traces the number of entries in the table of external IDs used as indexes by the backing store. |
|||
|
|
|
Log Scale |
This option should be used when the range of your data is very broad. When checked, the values are displayed using a logarithmic scale rather than using the actual values so that data on the extreme ends of the scale can be viewed more effectively. For example, if you have data that ranges from the tens to the thousands, the data in the range of the tens will be neglected visually if you do not check this option.
|
|
|
|
|
Time Settings |
Select a time range from the drop down menu varying from 5 Minutes to Last 7 Days. By default, the time range end point is the current time.
To change the time range, deselect the now toggle, which displays some additional date fields. You can click the left and right arrow buttons to decrease the end time by one time period (the time selected in the Time range drop down) per click, or you can choose the date and time from the associated calendar and clock icons. You can also enter the date and time in the text field using the following format: MMM dd, YYYY HH:MM:ss. For example, Aug 21, 2018 12:24 PM. Click the now toggle to reset the time range end point to the current time.
|
|
|
|
Connection |
The JMX connection method specified in the connection property for a given engine. It is displayed as either a combination of the host and port fields (<host>:<port>), or the URL. This convention saves space on the display by avoiding empty fields. This information is provided as a convenience for those rare occasions where a user might wish to view the data directly in jconsole. |
||
|
|
Expired |
When true, performance data has not been received within the time specified (in seconds) in the Expire Time field in the Duration region in the RTView Configuration Application > (Project Name) > Solution Package Configuration > TIBCO BusinessEvents > DATA STORAGE tab. The Delete Time field (also in the Duration region) allows you to define the amount of time (in seconds) in which the row will be removed from the table if there is no response. |
||
|
|
Storage Enabled |
When checked (true), this feature is enabled. |
||
|
|
Critical/Warning |
The number of critical and warning alerts. |
||
|
|
Node ID |
A unique string that identifies the node. |
||
|
|
Version |
The approximate TIBCO BusinessEvents version, as configured by the connection property. The exact version information is not available via JMX. |
||
|
|
Last Update |
The date and time the data was last updated in the display. |
||
