|
CHAPTER 2
|
Using the Monitor |
Welcome to RTView Enterprise. This section describes how to access the Monitor and the many displays that come with RTViewCentral.
Login to RTView Enterprise
Browse to: http://localhost:11070/rtview-central (login as rtvadmin/rtvadmin or rtvuser/rtvuser).
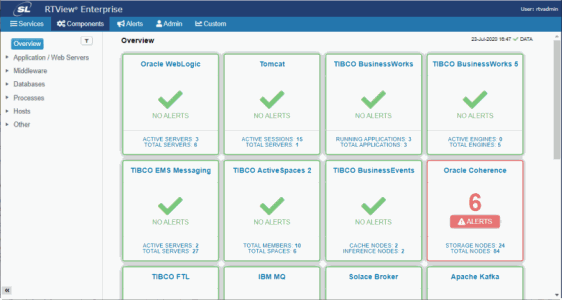
The Overview page (shown below), located in the Components tab, opens by default. Notice the navigation tabs in the title bar--the Services Tab, Components Tab, Alerts Tab, Admin Tab and the Custom Tab--this section describes each of them.

Displays
RTView© Enterprise provides multiple sets of displays for monitoring your system. Some displays come with and reside on RTViewCentral. Additional displays can be added on via RTView DataServers. This section describes RTViewCentral and RTView DataServers, their roles and the types of displays they provide.
The following figure illustrates RTViewCentral, a single RTView DataServer and the basic data flow from the monitored data sources.

RTView DataServers collect and store metric data from your data sources. RTViewCentral provides the graphic visualization of the metric data collected by RTView DataServers. Performance data collected by RTView DataServers are correlated with the displays that come with RTView Enterprise. For more detail about the relationships between these components, refer to the Architecture section.
By default, data is collected every 15 seconds and displays are refreshed 15 seconds afterward.
This section contains:
For details about displays that you can add-on via RTView DataServers, see the following chapters:
©2013-2021 Sherrill-Lubinski Corporation. All Rights Reserved.

