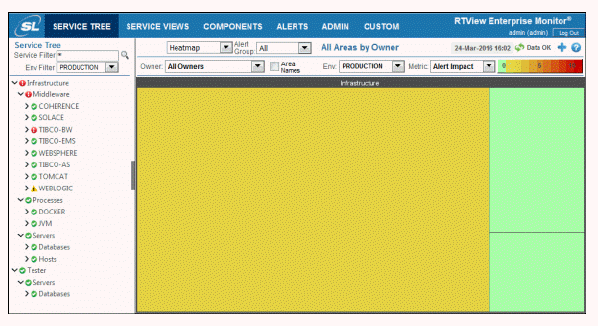
The SERVICE TREE tab provides a tree structure view of your defined CMDB with 4 levels of hierarchy: Owner>Area>Group>Service (see Fundamental Structure of Displays for more information). This tab is the primary source for understanding the health of your services and for drilling down to analyze issues. The Service Tree, which is configurable, shows user-defined logical groupings of the infrastructure and middleware used to support applications and should be set up to represent how support personnel like to conceptually think of the vast number of items that are being monitored. These groupings could, for example, contain a collection of monitored component ID (CIs) used to support a specific application or a service, or they could contain CIs relevant to varying technologies located at specific data centers. The Service Tree aggregates the current alert state of any item in a group to indicate which groups have items that need to be investigated, and you can use a variety of visual clues to prioritize and analyze the issues. You can also determine priority using the Alert Impact view in the heatmaps to identify which alert conditions will be the most impactful to your business, and you can then analyze the situation using a variety of tools including:
Key Metrics: allows you to view the cross-correlation of CIs relevant to a grouping or service and how their performance may affect each other and the services they support. For details, see Key Metrics Views.
Drill Down CI Summary Views: provides a way to analyze how a particular CI has been performing over time.
Metric Explorer: allows you to choose specific metrics to chart when analyzing several critical performance metrics over time. For details, see Metric Explorer.
This tab allows you to filter the navigation tree content by service and environment (see figure below). The environment you select also sets the Environment filter on the main panel. Note that changing the Environment filter on the main panel does not set the Environment filter in the navigation panel.

Each level within the Service Tree has a red, yellow, or green icon next to it, which indicate the highest alert level for that particular Owner, Area, Group, or Service. These icons allow you to instantly recognize problem areas within your system and allow you to drill down to quickly find the source of the issue. A red icon  indicates that one or more alerts exceeded their ALARM LEVEL threshold, a yellow icon
  indicates that one or more alerts exceeded their WARNING LEVEL threshold, and a green icon
  indicates that no alerts exceeded their WARNING or ALARM LEVEL threshold.
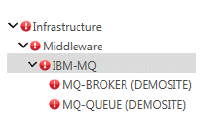
The Owner, Area, and Group automatically display the icon representing the highest level alert for their associated services with red (ALARM LEVEL threshold exceeded) being the most serious, yellow (WARNING LEVEL threshold exceeded) being intermediate, and green meaning everything is functioning normally. For example, if any of the services within a particular Owner>Area>Group have one or more alerts that exceeded their ALARM LEVEL threshold and, hence, have a red icon next to it in the tree, then the associated Owner, Area, and Group levels will also have the same red icon. In the example below, you can see that the MQ Broker service has one or more alerts that exceeded their ALARM LEVEL threshold and has a red indicator. As a result, the Owner, Area, and Group also have the red indicator
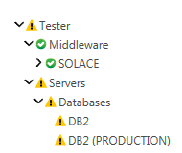
If the highest alert level for the services within a particular Owner>Area>Group is a service that has one or more alerts that exceeded their WARNING LEVEL threshold and, hence, has a yellow icon next to it in the tree, then the associated Owner, Area, and Group levels will also have the same yellow icon. In the example below, you can see that the DB2 database has one or more alerts that exceeded its WARNING LEVEL threshold and has a yellow indicator. Since none of the other services in this particular tree have alerts that exceeded their ALARM LEVEL threshold, then the associated Owner, Area, and Group also have the yellow indicator since the WARNING LEVEL threshold is the highest alert level threshold exceeded.
The following displays are available in the following levels in this tab:
Owner Level (top level)
To access the following displays, select an Owner Level option (Infrastructure, for example) to display an Owner level display. Select one of the following options from the drop-down in the upper left-hand corner of the display to view the associated display:
|
Drop-down Option |
Display |
Description |
|---|---|---|
|
Heatmap |
Heatmap of the most critical alerts for all Areas of your system, with the option to filter by Owner, Environment and alert Metric. |
|
|
Area |
Table of data shown in the Area Heatmap with the option to filter by Owner and Environment. |
Note: When selecting an Owner Level option, the display that opens by default will be the one that was last selected. For example, if Heatmap was the display that was previously selected, Heatmap will display by default again.
Area Level (second level down)
To access the following displays, select an Area Level option (Middleware in the example above) to display an Area Level display. Select one of the following options from the drop-down in the upper left-hand corner of the display to view the associated display:
|
Drop-down Option |
Display |
Description |
|---|---|---|
|
By Group |
Heatmap of alert states for Services by Area, with the option to filter by Area, Group, Environment and alert Metric, and the option to show Group and Service Names. |
|
|
By Region |
Heatmap as described for the Group / Service Heatmap (above), with the option to filter by Region and no option to show Service Names. |
|
|
Table |
Table of data shown in the Group/Service Heatmap. |
|
|
By CI Type |
Table that shows the health state of Services per CI Type. |
|
|
History |
Heatmap of alert states, over time, for Services in a selected Area, with the option to filter by Group, Environment and alert Metric. |
Note: When selecting an Area Level option, the display that opens by default will be the one that was last selected. For example, if Group/Service Heatmap was the display that was previously selected, Group/Service Heatmap will display by default again.
Group Level (third level down)
To access the following displays, select a Group Level option (IBM-MQ in the example above) to display a Group Level display. Select one of the following options from the drop-down in the upper left-hand corner of the display to view the associated display:
|
Drop-down Option |
Display |
Description |
|---|---|---|
|
By Group |
Heatmap of alert states for Services by Area, with the option to filter by Area, Group, Environment and alert Metric, and the option to show Group and Service Names. |
|
|
By Region |
Heatmap as described for the Group / Service Heatmap (above), with the option to filter by Region and no option to show Service Names. |
|
|
Table |
Table of the data shown in the Single Area: Group/Service Heatmap. |
|
|
By CI Type |
Table that shows the health state of Services per CI Type. |
|
|
History |
Heatmap of alert states, over time, for Services in a selected Area, with the option to filter by Group, Environment and alert Metric. |
Note: When selecting a Group Level option, the display that opens by default will be the one that was last selected. For example, if Group/Service Heatmap was the display that was previously selected, Group/Service Heatmap will display by default again.
Service Level (fourth level down)
To access the following displays, select a Service Level option (MQ Broker (DEMOSITE) in the example above) to display a Service Level display. Select one of the following options from the drop-down in the upper left-hand corner of the display to view the associated display:
|
Drop-down Option |
Display |
Description |
|---|---|---|
|
By CI Type |
Table of alert states for a Service organized CI Type, with general alert information. |
|
|
Summary |
Table of CIs by Service, with detailed alert information. |
|
|
Health |
Heatmap of CIs by Service, with the option to filter by Owner, Area, Group, Environment and alert Metric, and show CI Names. |
|
|
KM Heatmap |
Heatmap of Key Metrics current data for one or more Services in your CMDB hierarchy. |
|
|
KM Table |
Table of Key Metrics current data for one or more Services. |
|
|
KM History |
History heatmap of Key Metrics historical data for one or more Services. |
|
|
KM History (Alt) |
History heatmap of Key Metrics historical data for one or more Services. |
Note: When selecting a Service Level option, the display that opens by default will be the one that was last selected. For example, if By CI Type was the display that was previously selected, By CI Type will display by default again.
Select the following button, which is available when you select either By CI Type (Service By CI Type display) or Summary (Service Summary display) from the drop-down list, to open the associated display:
|
Button |
Display |
Description |
|---|---|---|

|
The Metric Explorer (MX) is a tool for creating and viewing custom dashboards, referred to as MX Views. |