 , the color is green when the value is close to 0 changing to yellow, orange and red as the value gets closer to 100. Values at or over 100 are shown as red.
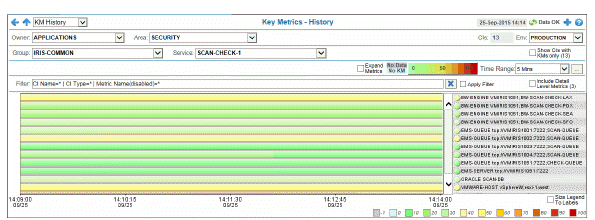
View history heatmap of Key Metric data, over time, for a selected Group and Service.
This is the most important view for analyzing the correlation between a variety of Key Metrics over time that are related to a Service. You would navigate to this view if:
you have identified a Service in the Alert Impact View that is having degradation right now. You can select the Service and navigate to the Service KM History display to determine if there are various factors causing the degradation.
you have looked at the Service KM Heatmap or the Service KM Table and identified a Service that is about to become degraded. You can navigate to the Service KM History display to proactively analyze the Service before issues arise.
Each row in the history heatmap represents a different CI, unless the Expand Metrics checkbox is selected, in which case it represents a metric on a CI. The row color shows the Threshold % and Quality values.
The Threshold % value is rounded up to the closest 10 unless the Quality is less than 1, in which case it shows the Quality. As shown in the color gradient bar , the color is green when the value is close to 0 changing to yellow, orange and red as the value gets closer to 100. Values at or over 100 are shown as red.
|
|
|
CIs associated with multiple Services are shown once for the first Group and Service they were associated with, and labeled + x more, where x is the number of additional Groups and Services the CI is associated with.
Select Expand Metrics to show each Key Metric in its own row and include the Metric Name, Metric Value and Threshold labels in the mouseover popup window.
For an overview about the Key Metrics feature, see Key Metrics Views.
For Key Metrics definitions by technology, see Available KM Metrics and Alerts
Use the available drop-down menus or right-click to filter data shown in the display. Drill-down and investigate by double-clicking a row to view details in the corresponding display.
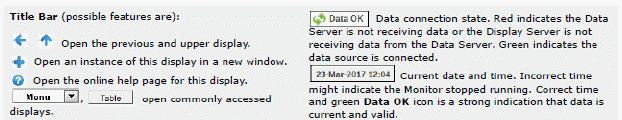
Note: The “Up” Arrow (![]() ) opens the most recently viewed display under Multi Area Service Views. For example, if the last viewed display under Multi Area Service Views was Services CI Type Summary, then clicking
) opens the most recently viewed display under Multi Area Service Views. For example, if the last viewed display under Multi Area Service Views was Services CI Type Summary, then clicking ![]() opens the Services CI Type Summary display.
opens the Services CI Type Summary display.
|
Filter By: The following filtering options are typically included: |
||||
|
|
Owner: Choose an Owner to see metrics for Areas associated with that Owner. Area: Choose an Area to see metrics for Groups associated with that Area and Owner. Group: Choose a Group to see metrics for Services associated with that Group, Area and Owner. Service: Choose a Service to see metrics for Environments associated with that Service, Group, Area and Owner. Env: Choose an Environment to see metrics for Environments associated with that Service, Group, Area and Owner. |
|||
You can also filter KMs by CI Name, CI Type and Metric Name. To modify the CI Name, CI Type or Metric Name filter, right-click on an item and select CI Name, CI Type or Metric Name from Add To Filter or Remove From Filter, then click Apply Filter  . The Filter: field shows filter parameters and is highlighted in blue after it is applied. Click Clear
  to clear the filter.
Note: The Metric Name filter is only editable or applied when the Expand Metrics checkbox is selected.
|
Fields and Data This display includes: |
|||
|
|
Show CIs with KMs only (x) |
When selected, hides any CIs that do not have KMs defined. The number following the label (x) is the number of CIs with KMs defined. |
|
|
|
Expand Metrics |
When selected, shows one element (for example, a table row, status history row or heatmap cell) per KM per CI. When not selected, shows one element per CI with the aggregated value of all KMs for that CI. KMs are aggregated by taking the maximum Threshold % and the minimum Quality value for the CI. |
|
|
|
|
The No Data No KM is the legend for the display colors if the Quality value for the data is less than 1. If no KMs are defined for the CI Type, the Quality is set to 0 and the color is shown as teal. If KMs are defined for the CI Type, but no data was returned when the metric was queried, the Quality is set to -1 and the color is shown as gray. If data was received for the metric, the Quality is set to 1 and the color is set based on the Threshold % value as described above. If the If the Expand Metrics checkbox is selected, this is the Quality of a single KM. If the Expand Metrics checkbox is not selected, this is the lowest Quality for all of the KMs on the CI. |
|
|
|
|
The gradient bar is the legend for the display colors, which are determined by the Threshold % and Quality values. A row is green when the value is close to 0 changing to yellow, orange and red as the value gets closer to 100. Values at or over 100 are shown as red.
|
|
|
|
Time Range |
Select a time range from the drop down menu varying from 2 Minutes to Last 7 Days, or display All Data. To specify a time range, click Calendar 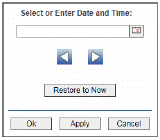
By default, the time range end point is the current time. To change the time range end point, click Calendar Use the navigation arrows Click Restore to Now to reset the time range end point to the current time. Note: To limit the memory used by the KM history displays, the available time ranges are limited by the number of CIs in the selected Group and Service. This limit can be modified using the $rtvKmHistoryRowLimit substitution. The $rtvKmHistoryRowLimit substitution sets the maximum number of rows that can be queried by a history display and this number is used to determine the available time ranges. The default value is 35000. To change the limit (and the maximum amount of memory used by KM history display), set the following property to a different value: sl.rtview.sub=$rtvKmHistoryRowLimit:35000. |
|
|
|
Filter: |
Shows the current filter parameters and is highlighted in blue when the filter is applied. By default, all data is shown: CI Name=* | CI Type=* | Metric Name(disabled)=* To modify the filter of KMs displayed, right-click on an item in the table and select CI Name, CI Type or Metric Name from Add To Filter or Remove From Filter, then click Apply Filter |
|
|
|
|
|
Clears the filter parameters. |
|
|
|
|
Applies the filter parameters. |
|
|
Include Detail Level Metrics (##) |
When selected, includes Detail Level KMs in the display. When not selected, only includes high level KMs. The number following the label (x) is the number of detail level metrics available for the currently displayed KMs. |
|
|
Mouseover |
|||
|
|
Group |
The Group name. For CIs that are associated with multiple Groups, the name of the first Group the CI was associated with is shown and labeled + x more, where x is the number of additional Groups the CI is associated with. |
|
|
|
Service |
The Service name. For CIs that are associated with multiple Services, the name of the first Service the CI was associated with is shown and labeled + x more, where x is the number of additional Services the CI is associated with. |
|
|
|
CI Type |
The CI Type. |
|
|
|
CI Name |
The CI Name. |
|
|
|
Metric Name |
The name of the metric. This is only included if the Expand Metrics checkbox is selected. It is the user-friendly metric name, which corresponds to a numeric column in one of the caches associated with the CI Type. To see which cache column provides data for this metric, navigate to Architecture - RTView KM Defs. In the table, look in the CITYPE and SELECTOR columns to find the row for your metric. The CACHENAME column lists the name of the cache containing the metric and the METRICNAME column contains the name of the cache column. |
|
|
|
Metric Value |
The value of the metric. This is only included if the Expand Metrics checkbox is selected. |
|
|
|
Threshold |
The Alarm Level value for the alert associated with the metric. This column is only included if the Expand Metrics checkbox is selected. To see which alert is associated with this metric, navigate to Architecture - RTView KM Defs. In the table, look in the CITYPE and SELECTOR columns to find the row for your metric. The AlertName column lists the name of the alert associated with the metric. Note: When looking up the alert threshold for a KM, RTView Enterprise first looks to see if there is an alert override on the alert where the AlertIndex exactly matches the CIName (ignoring the ~ and ; delimiters). If an exact match is found, the override Alarm Level is used. If no exact match is found, the Default Alarm Level for the alert is used. Note that some alert overrides only contain a partial index and are not used for KM thresholds. |
|
|
|
Threshold % |
The percent of the Metric Value against the Threshold. If the Expand Metrics checkbox is selected, this is the Threshold % of a single KM. If the Expand Metrics checkbox is not selected, this is the highest Threshold % for all of the KMs on the CI. Depending on the KM, different scales are applied. By default, no scale is applied, but values are limited to 0-10000. For memory metrics, an exponential scale is applied to the Threshold % so that lower values are diminished. For metrics where the alert is a low alert (an alert that executes when the value goes below the threshold), an inverse scale is applied. The colors in the KM displays are based on this value going from green when the value is close to 0 changing to yellow to orange to red as the value gets closer to 100. Values at or over 100 are shown as red |
|
|
|
Quality |
Indicates the quality of the data. If the Expand Metrics checkbox is selected, the value is for a single KM on the CI. If the Expand Metrics checkbox is not selected, the value is for all the KMs on the CI, and shows the lowest Quality of those KMs. Possible values are: 0 = No KMs are defined for the CI Type (the color is shown as teal). -1 = KMs are defined for the CI Type, but no data was returned when the metric was queried (the color is shown as gray). 1 = Data was received for the metric (the color is set based on the Threshold % value). |
|
|
|
Time |
The time stamp of the data. |
|
|
|
Size Legend To Labels |
When selected, the width of the legend is set to the widest label. When not selected, the width of the legend is set to 20% of the available space and labels that are too wide are clipped. |
|
 Red indicates the value is at or over
  Yellow indicates the value is between
  Green indicates the value is close to
  Teal indicates no KMs are defined for the CI Type.
  Grey indicates KMs are defined for the CI Type but no data was returned when the metric was queried.

 Red indicates the value is at or over
  Yellow indicates the value is between
  Green indicates the value is close to
  Teal indicates no KMs are defined for the CI Type.
  Grey indicates KMs are defined for the CI Type but no data was returned when the metric was queried.
  .
.  and select a date and time from the calendar or enter the date and time in the text field using the following format:
  to move forward or backward one time period. NOTE: The time period is determined by your selection from the
  . Click Clear
  to clear the filter.

 . To see which