IBM MQ
The IBM MQ HTML displays provide extensive visibility into the health and performance of IBM MQ. This features an IBM MQ Overview Display (pictured below).
Note: This document assumes familiarity with IBM Websphere MQ. For details about IBM MQ, refer to vendor documentation.
The following IBM MQ Views (and their associated displays) can be found under Components tab > Middleware> IBM MQ:
|
•
|
IBM MQ Brokers View: The displays in this View present performance and utilization metrics for your IBM MQ Brokers. |
|
•
|
IBM MQ Channels View: The displays in this View present performance and utilization metrics for your IBM MQ Channels. |
|
•
|
IBM MQ Queues View: The displays in this View present performance and utilization metrics for your IBM MQ Queue Managers. |
|
•
|
IBM MQ Topics View: The displays in this View present performance and utilization metrics for your IBM MQ Topics. |
|
•
|
IBM MQ Topic Configs View: The displays in this View present performance and utilization metrics for your IBM MQ Topic Configs. |
|
•
|
IBM MQ Subscriptions View: The displays in this View present performance and utilization metrics for your IBM MQ Subscriptions. |
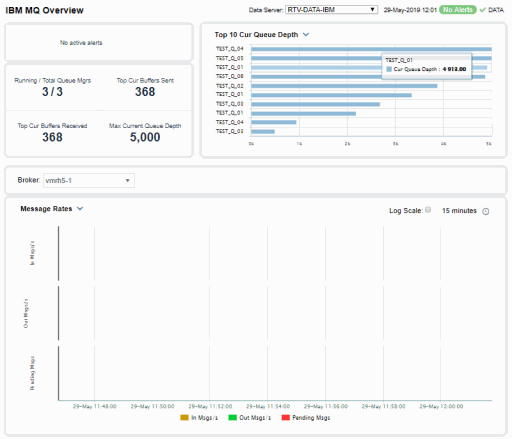
IBM MQ Overview Display
The IBM MQ Overview is the top-level display for the IBM MQ Solution Package, which provides a good starting point for immediately getting the status of all IBM MQ objects on your Data Server.
You can select the RTView Data Server for which you want to see data and easily view the current data for that DataServer including:
|
•
|
The total number of Active Alerts, including the total number of critical and warning alerts. |
|
•
|
The number of queues Running and the Total Queue Managers. |
|
•
|
The number of Buffers Sent and Buffers Recieved. |
|
•
|
The Maximum Current Queue Depth. |
|
•
|
A bar graphs showing the Top 10 Current Queue Depth or the Oldest Message Age. Click a bar to drill-down to details in the IBM MQ Queue Summary. |
You can hover over each region in the upper half of the Overview to see more detail. You can also drill-down to see more detail (such as in the IBM MQ Broker Connections Table display) by clicking on each respective region in the Overview.
You can select a Broker for the trend graph to trace Message Rates (In Msgs/second, Out Msgs/second and Pending Msgs) or Message Flows. You can hover over the trend graph to see the values at a particular time. You can specify the time range for the trend graph and view data based on a log scale, which enables visualization on a logarithmic scale and should be used when the range in your data is very broad.
©2013-2021 Sherrill-Lubinski Corporation. All Rights Reserved.